It is May 2022, and a Meta AI team is about to do something no lab training a 175-billion-parameter model had done before: publish the on-call logbook. Over the next two years, three released model families — one a research reproduction, one a publicly funded multilingual collaboration, one an industrial-scale open-weights flagship whose vendor chose transparency about the process anyway — turn the previously private mess of a frontier training run into a public record of what actually happens when the optimizers, parallelism strategies, and memory tricks from the preceding chapters are all switched on at once, for months, on thousands of accelerators that fail.
Where We Were
By 2022 the individual pieces were well understood. AdamW (owned by chapter 5) and normalization (owned by chapter 6) kept a single step stable; mixed precision (owned by chapter 7) made that step cheaper; ring all-reduce and the linear scaling rule (owned by chapter 8) let many accelerators agree on a gradient; tensor and pipeline parallelism (owned by chapter 9) let a model too large for one accelerator be split across many; and ZeRO-style sharding and FSDP (owned by chapter 10) cut the memory each accelerator had to hold. What none of the papers introducing those techniques described was what happened when all of them ran together, continuously, for the weeks or months a frontier-scale model actually takes to train.
The papers that had trained at this scale before 2022 — GPT-3 in 2020, Gopher and Chinchilla shortly after — said almost nothing about the process itself. Model cards reported final loss and downstream benchmark scores; they did not report how many times the run had crashed, why, or how the team had responded. A reader could reconstruct the architecture and the optimizer schedule from the paper, but not the operational reality: the loss spikes that required a rollback, the node that silently corrupted a batch of activations, the week spent debugging whether a stalled step was a software deadlock or a failed network switch. That reality existed — anyone running a multi-thousand-GPU job for months encountered it — but it was invisible to everyone outside the lab that produced it, which meant every new team training at this scale relearned the same lessons from zero.
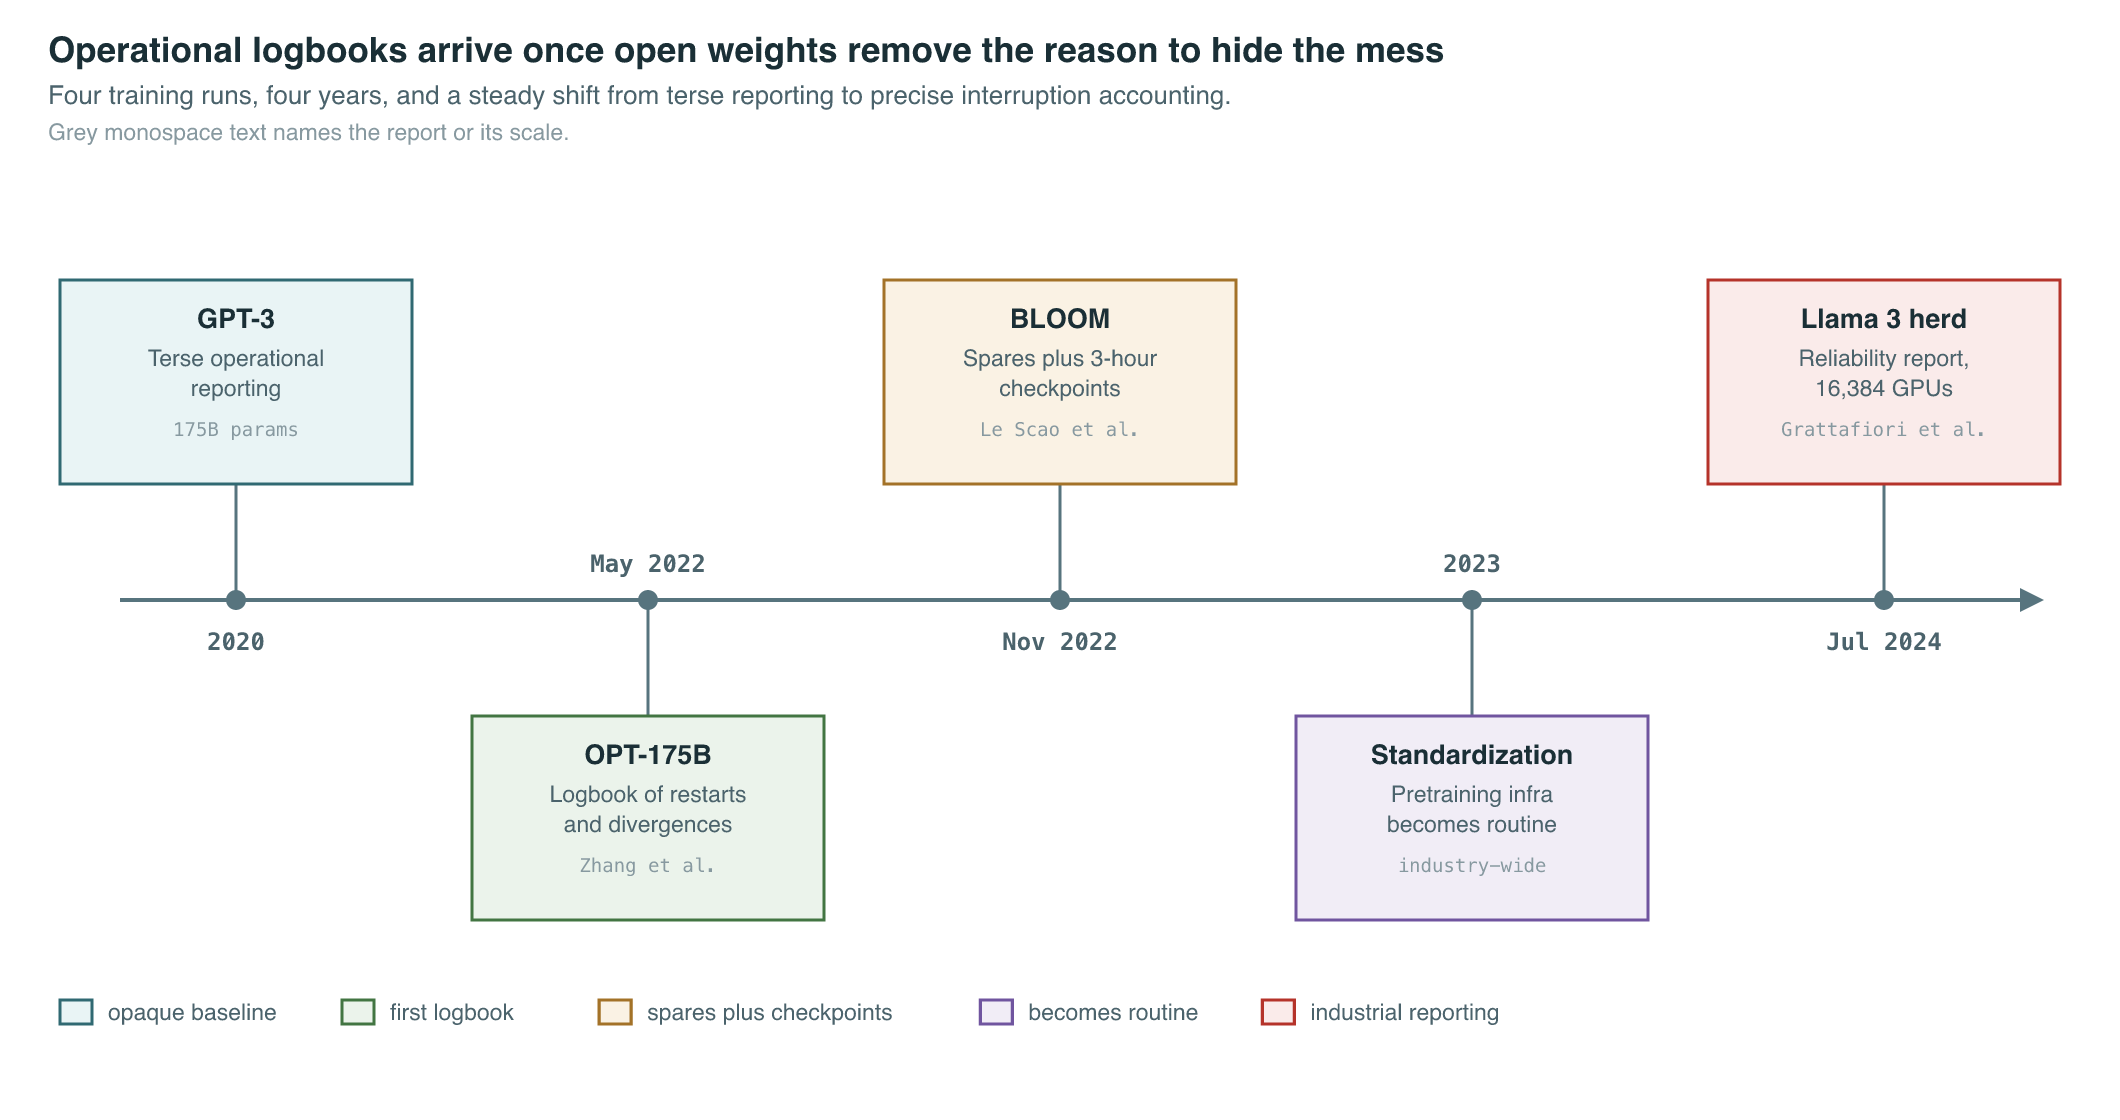
Two structural facts made 2022–2024 the moment this changed. First, open-weights releases created an incentive to also release the process, since a lab publishing weights without matching commercial secrecy had little reason to hide the mess behind them. Second, as cluster sizes grew from the hundreds of GPUs typical in 2020–2021 to the tens of thousands typical by 2024, failures stopped being rare edge cases and became a first-order cost that had to be measured, budgeted, and engineered around rather than treated as an embarrassing footnote.
The Breakthrough
Act one: the logbook. “OPT: Open Pre-trained Transformer Language Models” (Zhang et al., 2022), submitted by Meta AI in May 2022, trained a 175-billion-parameter decoder-only transformer on 992 80GB A100 GPUs using Fully Sharded Data Parallel combined with Megatron-LM tensor parallelism — deliberately without pipeline parallelism, which the authors describe as the only known open reproduction of a training run at this scale using that combination. The run reached 147 TFLOP/s of utilization per GPU. Alongside the weights, Meta released a full logbook of the training process: over the roughly two months of the run, the team recorded at least 35 manual restarts and the cycling of more than 100 hosts due to hardware failures, plus an estimated 70 or more additional automatic restarts. Loss divergences were correlated with the dynamic loss-scaling factor collapsing to zero and with activation-norm spikes in the model’s final layers; the team’s response included lowering the learning rate, reverting to earlier checkpoints, and — during one stretch — switching the optimizer from AdamW to plain SGD when AdamW instability persisted, before reverting to AdamW once SGD plateaued. The paper reports OPT-175B’s training emitted an estimated 75 tons of CO2-equivalent, about one-seventh of the roughly 500 tons the authors attribute to GPT-3, though they note that figure roughly doubles once ablations and downtime are included.
Act two: the collaboration. “BLOOM: A 176B-Parameter Open-Access Multilingual Language Model” (Le Scao et al., 2022), submitted by the BigScience Workshop in November 2022, trained a 176-billion-parameter model on the ROOTS multilingual corpus using 384 NVIDIA A100 80GB GPUs across 48 nodes of the publicly funded Jean Zay supercomputer, with four spare nodes held in reserve. The run took about 3.5 months and consumed roughly 1.08 million GPU-hours, reaching a peak throughput of 156 TFLOPs per GPU — about half of the A100’s 312 TFLOPs theoretical BF16 peak. Checkpoints were saved every three hours. Hardware failures were routine — one to two GPU failures per week — but the combination of spare nodes and frequent checkpointing meant these failures barely dented overall throughput. The team reported only one loss spike during the entire run, from which the model recovered without intervention, and attributed part of that stability to training in bfloat16 after encountering instabilities with float16 in earlier, smaller-scale experiments (mixed precision is owned by chapter 7).
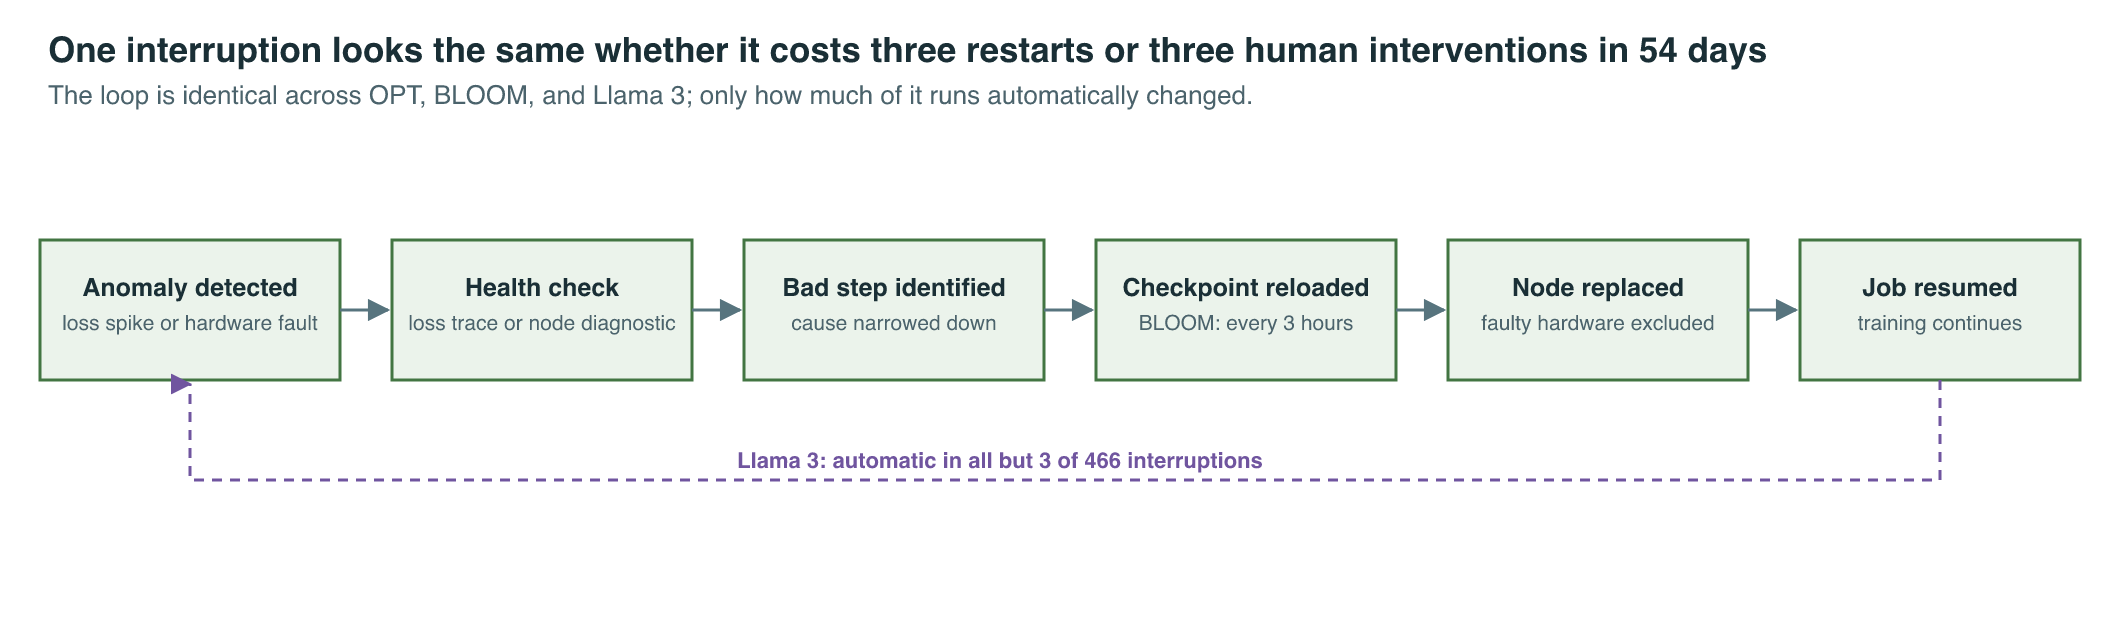
Act three: the industrial run. “The Llama 3 Herd of Models” (Grattafiori et al., 2024), submitted by Meta in July 2024, trained its largest model — 405 billion parameters, on 15.6 trillion tokens — using up to 16,384 H100 GPUs. Where OPT used two forms of parallelism and BLOOM largely one, Llama 3’s flagship run combined four: tensor parallelism split eight ways, pipeline parallelism across sixteen stages, context parallelism spanning up to sixteen groups for the model’s longer-sequence training phases, and fully sharded data parallelism with a group size ranging from 4 to 128 depending on configuration — a combination the paper calls 4D parallelism, layering the model-splitting techniques of chapters 8 and 9 on top of each other rather than choosing one. Measured BF16 Model FLOPs Utilization ranged from 38% to 43% across the configurations reported: 43% at 8,192 GPUs, dropping to 41% at 16,384 GPUs because the larger job needed a smaller per-group batch size to hold the global token count constant, and 38% for the longest-context configuration. The team achieved an effective training time above 90% despite the scale. That last number came from confronting the failure problem directly rather than absorbing it quietly: across a 54-day snapshot of pretraining, the cluster logged 466 interruptions — 47 planned (automated maintenance) and 419 unexpected. Of the unexpected interruptions, faulty GPUs accounted for 30.1%, GPU HBM3 memory failures for 17.2%, software bugs for 12.9%, network switches and cables for 8.4%, unplanned host maintenance for 7.6%, GPU SRAM memory for 4.5%, GPU system processors for 4.1%, and NICs, NCCL watchdog timeouts, silent data corruption, and thermal issues each under 2%. Roughly three in five unexpected interruptions traced back to the GPUs or their memory. Despite that volume — an average of one interruption every few hours — human engineers had to intervene only three times across the entire snapshot; the rest were detected and recovered automatically.
The Mathematics
The instrument all three papers report against, explicitly or implicitly, is Model FLOPs Utilization: the fraction of an accelerator’s theoretical peak throughput a training run actually converts into useful work.
| Symbol | Meaning |
|---|---|
| Model FLOPs Utilization, fraction of peak achieved | |
| FLOPs required to process one training step | |
| Measured wall-clock time for one step | |
| Number of accelerators in the job | |
| Peak FLOPs/s of one accelerator, in the format used |
MFU measures efficiency while the job is running; it says nothing about how much wall-clock time is lost when the job stops running. That second quantity — what Llama 3’s authors report as effective training time — has its own accounting:
| Symbol | Meaning |
|---|---|
| Effective training time, as a fraction of total wall clock | |
| Downtime of interruption , detection to job stop | |
| Recovery overhead per interruption, checkpoint reload plus resync | |
| Total wall-clock duration of the run |
The interruption rate itself is not fixed — it scales with cluster size in a way that follows directly from treating each accelerator’s failures as an independent random process. If a single device fails, on average, once every hours, and a synchronous job of devices must halt whenever any one of them fails, the job-level mean time between failures is the mean of the minimum of independent failure times:
What It Enabled
The immediate effect was that “how reliable is this run” changed from an unanswerable question into a measured one, and the answer changed how runs were engineered rather than just how they were described after the fact.
| Model | GPUs | Params | Duration | Peak throughput / MFU | Failure cadence | Checkpoint interval | Human interventions |
|---|---|---|---|---|---|---|---|
| OPT-175B, 2022 | 992 × A100 80GB | 175B | ~2 months | 147 TFLOP/s per GPU | 35+ manual restarts, 100+ hosts cycled | not specified | frequent, manual |
| BLOOM, 2022 | 384 × A100 80GB | 176B | ~3.5 months | 156 TFLOPs per GPU, ~50% of peak | 1–2 GPU failures per week | every 3 hours | rare, absorbed by spares |
| Llama 3 405B, 2024 | up to 16,384 × H100 | 405B | 54-day snapshot reported | 38–43% BF16 MFU | 466 interruptions, ~1 every few hours | not specified | 3 in 54 days |
The trajectory across the three rows is the chapter’s central finding: as cluster size and interruption count both grew by roughly an order of magnitude, the human labor required to keep the run moving shrank rather than grew, because automated detection and restart absorbed the additional failure volume that the mathematics above predicts a bigger cluster will produce. OPT’s response to divergence was a team of engineers watching dashboards and manually rolling back checkpoints; Llama 3’s response to a comparable failure rate, scaled up roughly forty-fold in device count, needed a person only three times in nearly two months.
This has a direct compute-economics reading, not just an operations one. BLOOM’s 1.08 million GPU-hours were spent on a fixed, publicly funded allocation on Jean Zay, which made every hour lost to a restart a real, non-recoverable cost against a budget that could not simply be topped up; the three-hour checkpoint interval and reserved spare nodes were an explicit hedge against that scarcity. Llama 3’s cluster had, by comparison, an industrial scale of redundancy available, but redundancy of that kind is itself a purchasing decision: 16,384 H100s held in reserve capacity or run at less than full occupancy so that a failing node can be swapped without stalling the whole job is compute paid for and not directly converted into tokens processed. Effective training time is, in this sense, as much a line item for whoever is buying the cluster time as MFU is — a run reporting 40% MFU and 90% effective training time is telling a buyer that six in ten FLOPs and one in ten hours are both already spent before a single useful gradient step is counted, and that neither number is fixed by physics; both are functions of engineering investment in exactly the failure-handling machinery this chapter describes.
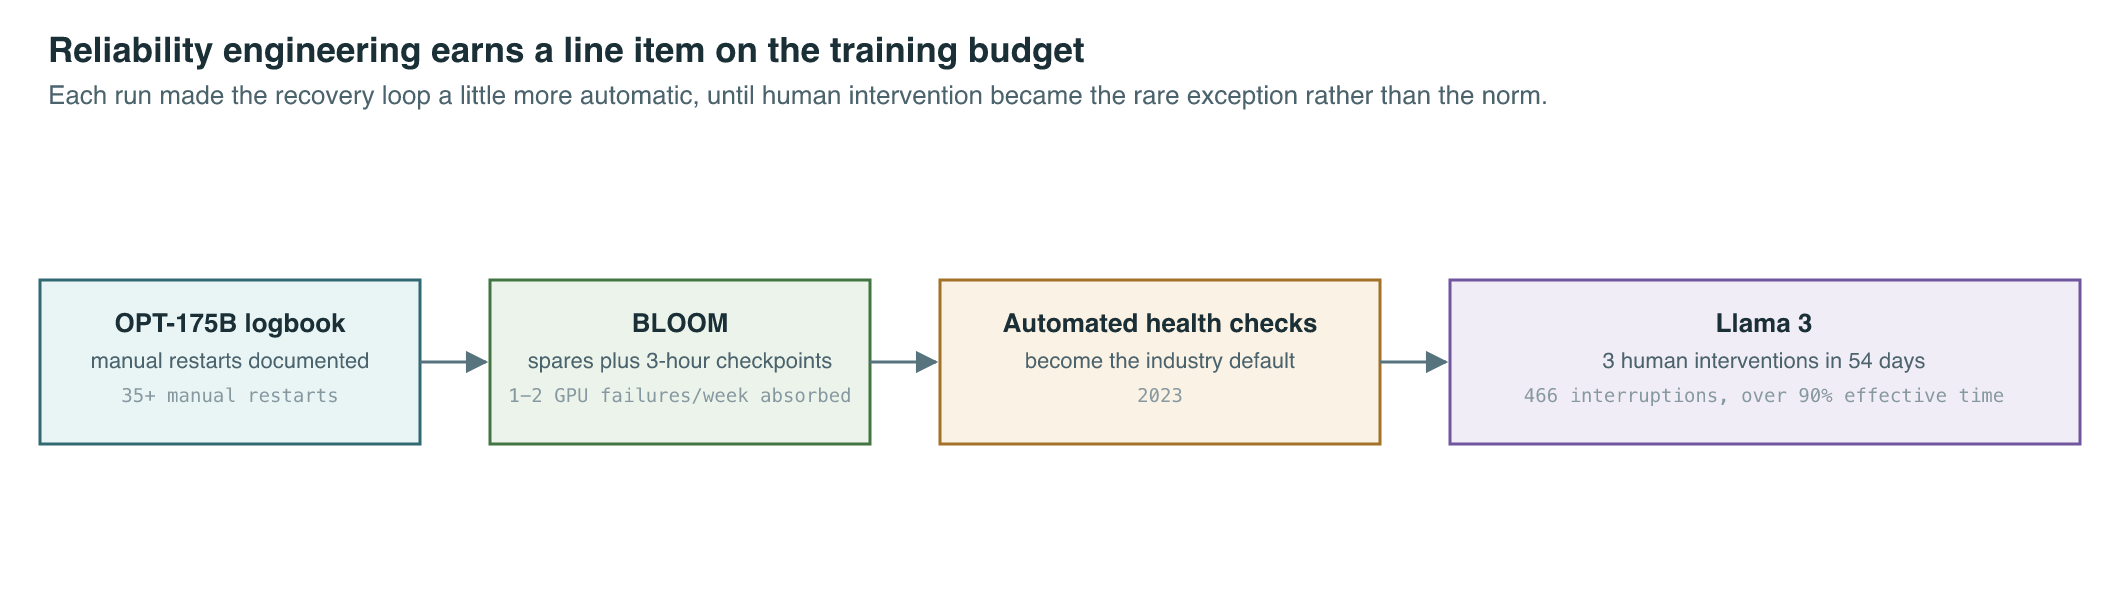
None of these three papers invented the underlying mechanisms that make recovery cheap — sharded checkpointing traces back to ZeRO and FSDP (owned by chapter 10), and the parallelism strategies being coordinated across thousands of devices are the tensor, pipeline, and data parallelism techniques owned by chapters 8 and 9. What OPT, BLOOM, and Llama 3 contributed was the operational record proving those mechanisms actually hold up at scale, and the MFU and effective-training-time instruments this chapter derives are the reason later chapters can compare training efficiency across hardware generations at all — the same accounting reappears when kernel-level throughput gains from FlashAttention are measured, when mixture-of-experts models report utilization despite sparse compute, and when the hardware roadmap itself is assessed in the co-evolution thesis.
Key Papers
| Paper | Authors | Year | Link | Why it matters |
|---|---|---|---|---|
| OPT: Open Pre-trained Transformer Language Models | Zhang et al. | 2022 | arXiv:2205.01068 | First public logbook of restarts, divergences, and optimizer swaps at 175B scale |
| BLOOM: A 176B-Parameter Open-Access Multilingual Language Model | Le Scao et al. | 2022 | arXiv:2211.05100 | Showed weekly hardware failures need not disrupt a run, given spares and frequent checkpointing |
| The Llama 3 Herd of Models | Grattafiori et al. | 2024 | arXiv:2407.21783 | Quantified interruption causes at 16K-GPU scale and reported over 90% effective training time |
PM Lens
Papers referenced
- OPT: Open Pre-trained Transformer Language Models Zhang et al. · 2022 · arXiv:2205.01068
- BLOOM: A 176B-Parameter Open-Access Multilingual Language Model Le Scao et al. · 2022 · arXiv:2211.05100
- The Llama 3 Herd of Models Grattafiori et al. · 2024 · arXiv:2407.21783