The promise. By the end of this chapter you will be able to walk into a board meeting and explain, in one breath, why the ad business you now run is structurally different from the open programmatic web you learned in Book 1 — and why that difference is the source of your margin, your data advantage, and your defensibility. More importantly, you will be able to tell the truth about it: which of the garden’s famous advantages you actually own on day one, which you still have to build, and which hidden liabilities — audience concentration, advertiser dependence, regulatory exposure — you must start hedging before they become the headline. This is the bridge chapter. It does not teach you how an ad auction works; Book 1 did that. It teaches you why your auction is different, and what that buys you.
You will be able to:
- Distinguish the open-web relay (advertiser → agency → DSP → exchange → SSP → publisher) from the walled-garden closed loop, and say precisely what changes when one company owns demand, auction, inventory, identity, and measurement.
- Defend to a board why owning the closed loop is the engine of margin and defensibility — not as a slogan, but with the flywheel mechanics and the comparable-platform numbers behind it.
- Reason about which structural advantages you inherit versus must construct, so you do not assume scale you have not earned.
- See early the three liabilities every garden carries — concentration, dependence, regulation — and frame them for the board before a regulator or a defecting advertiser frames them for you.
Builds on: Book 1 ch1–3 (the money flow, the supply chain, the RTB auction), ch4 (data and identity), and ch8 (walled gardens vs the open web). This chapter assumes you know what a DSP, SSP, exchange, and real-time auction are; it will not re-explain them.
The desk Maya inherits
Maya starts Monday as VP and GM of Ad Monetization at a top-five walled garden. She has done this before, sort of — an earlier tour running monetization at a challenger-scale platform, roughly 500 million daily users, where the hardest fact of life was a geo ARPU gap of something like 16x between her best market and her growth markets. The same lever she pulled there, she will pull here. But the altitude is different. Here the audience is measured in billions, the auction is hers, and the P&L she now owns is large enough that a single point of margin is a line item the CFO can see from space.
On her first day there is no welcome tour. There is a question on a slide, left over from the last board meeting, that nobody fully answered: “What, exactly, is the durable advantage of running our own ad stack — and where are we exposed?” That question is this chapter. Everything else in the book is the eighteen months of decisions that flow from how she answers it.
To answer it, she has to start where every monetization leader started: on the open web.
What you are leaving behind: the open-web relay
In the open programmatic world of Book 1, a single ad impression travels through a relay of independent companies. An advertiser hands budget to an agency; the agency operates a DSP (demand-side platform) that bids; the bid travels through an exchange into one or more SSPs (supply-side platforms) representing publishers; the winning bid renders on a page the advertiser has never seen, against a user identified — increasingly poorly — by third-party cookies and shared IDs. Real-time bidding (RTB) auctions the impression across many SSPs simultaneously, and on the open web that auction has largely settled into a second-price norm (you pay just above the runner-up). Measurement is stitched together afterward from a dozen vendors who each saw a fragment of the journey.
You know this machine. The thing to internalize as a leader is not how it works but what it costs the people inside it: every hop is a margin leak, a point of data loss, and a place where the signal degrades. The advertiser cannot fully see where the money went. The publisher cannot fully see who the buyer was. No single party owns the loop from “user saw it” to “user bought it.” That structural fragmentation is the open web’s defining feature — and it is precisely the thing a walled garden refuses to accept.
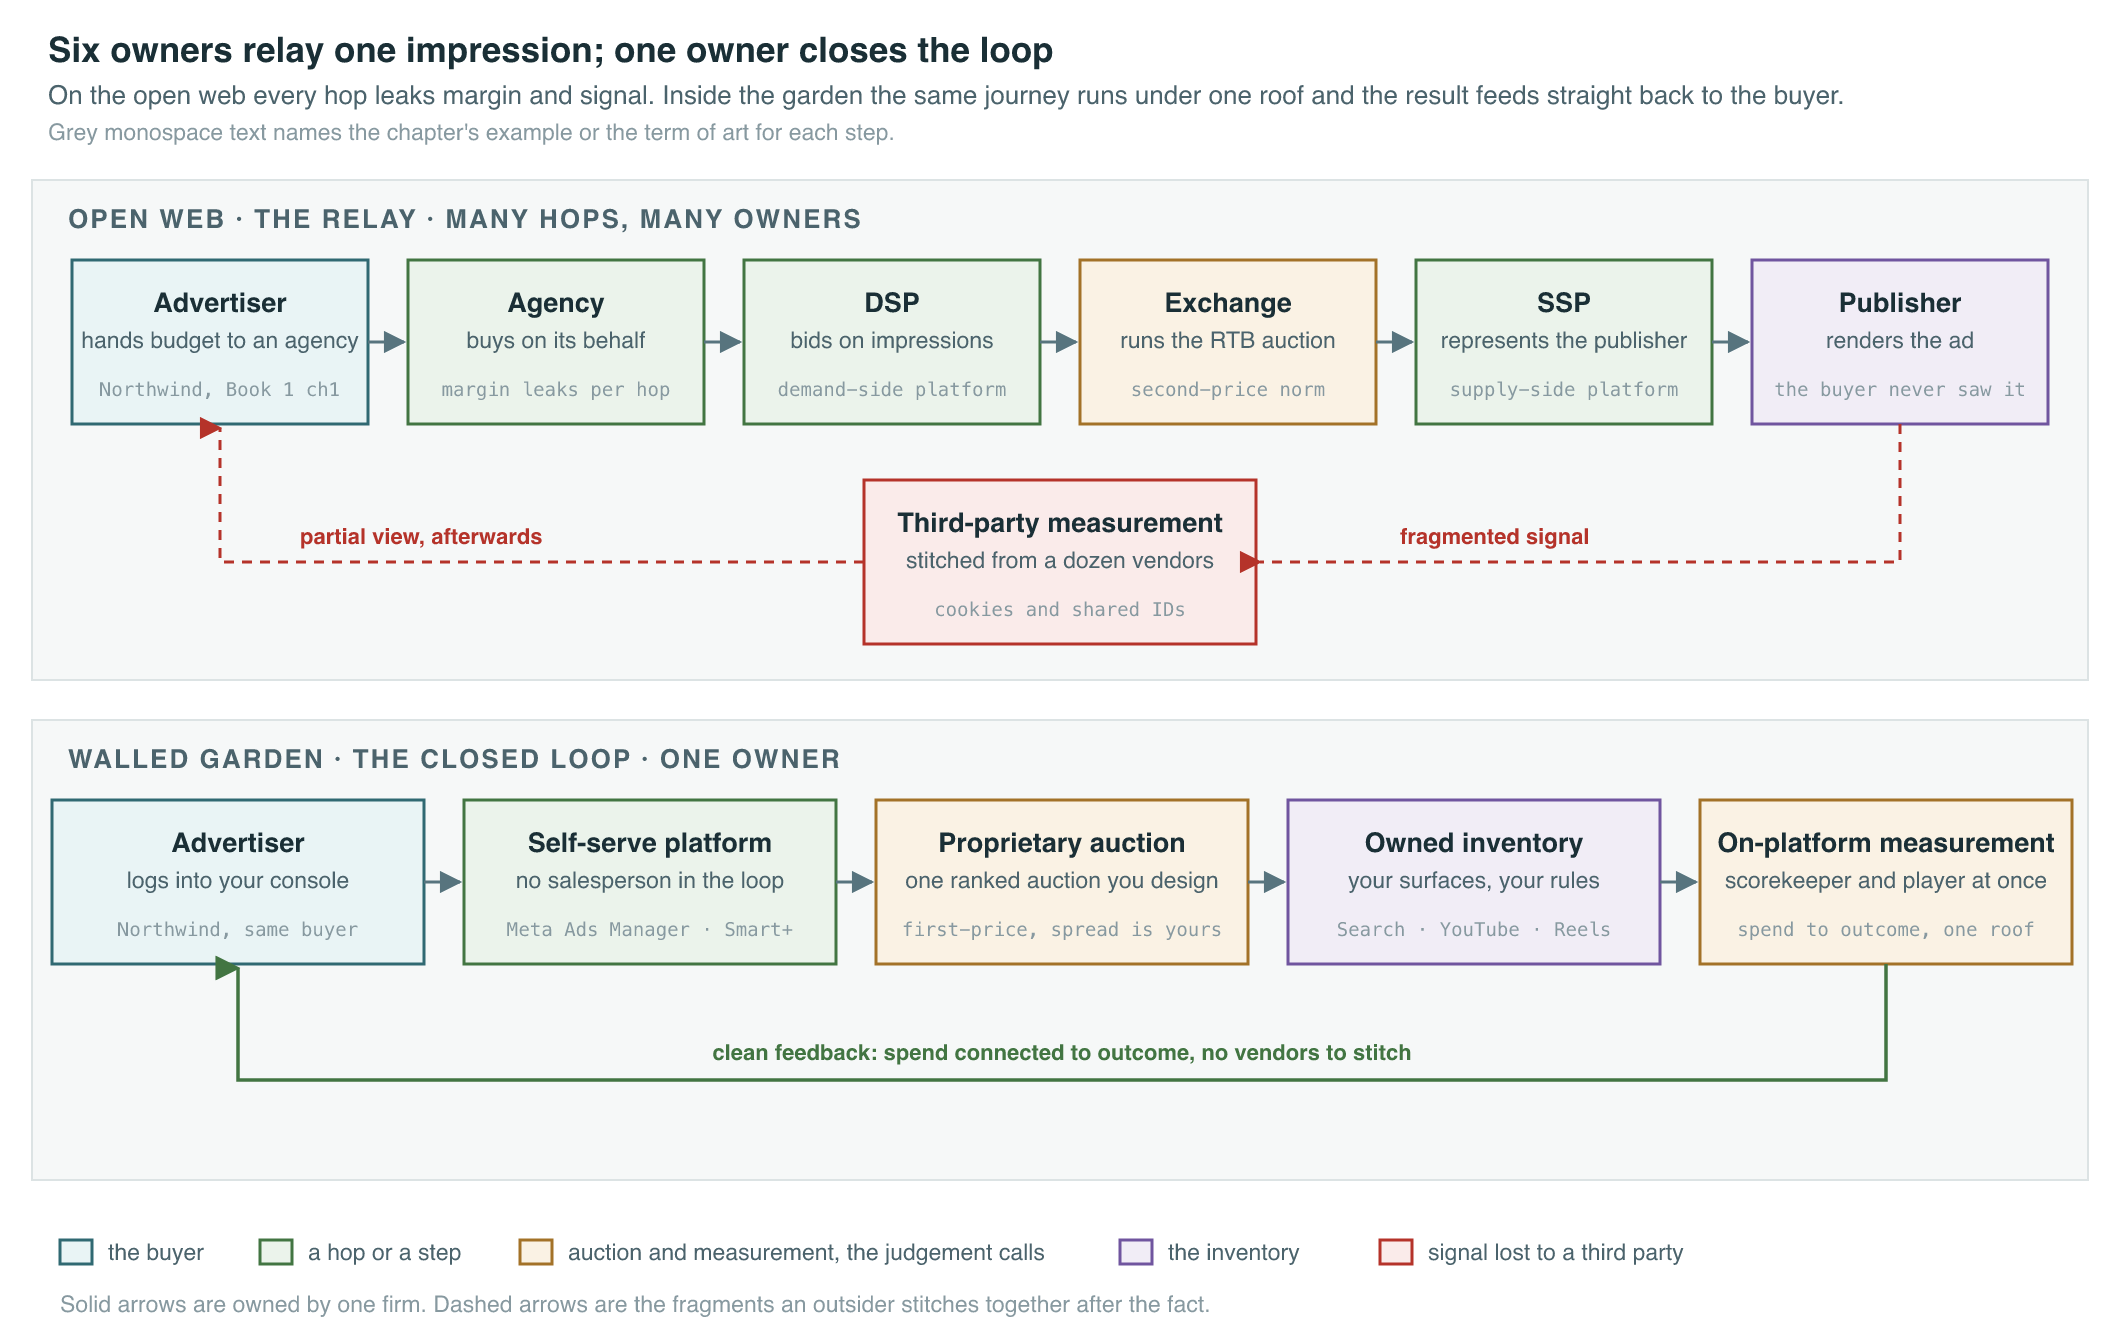
Figure 1.1 — The relay vs. the loop. On the open web, an impression passes through five or six independent companies and the result is measured, partially, by a seventh. In a walled garden, one company owns every step, and the measurement feeds straight back to the advertiser. The difference between a dotted line and a solid one is the difference between the two business models.
What you are inheriting: the closed loop
Step inside the garden and the relay collapses into a loop owned by one company. The advertiser logs into your self-serve tool, bids into your proprietary auction, wins your owned-and-operated inventory, is matched against your first-party identity graph, and is measured by your on-platform attribution. Demand, auction, inventory, identity, and measurement sit under one roof.
This is the term of art you will use constantly, so define it cleanly for yourself and your board. A walled garden (or owned-and-operated, O&O, ad business) is an ad platform where a single company controls the inventory it sells, the auction that prices it, the identity data that targets it, and the measurement that proves it worked. The open web is a market of many firms; the garden is a firm that has internalized the whole market.
Five things change structurally the moment you own all five pieces:
- First-party data at scale. You are not renting cookies or licensing a third-party segment that degrades the moment Apple or Google changes a setting. You observe your own logged-in users directly — what they watch, search, save, buy, follow. (Book 1 ch4 covered the collapse of third-party identity; the garden’s answer is simply not to depend on it.)
- A closed loop. Because the same company sees the ad served and the action taken on its own surfaces, it can connect spend to outcome without stitching vendors together. The feedback that trains your ranking models is yours.
- A single proprietary auction. There is no RTB across many SSPs. There is one auction — typically a first-price-style ranked auction (you design how bid and predicted relevance combine, and the clearing price is the bid you submit, not the runner-up’s, as on the open web) — that you control. You set the rules; you keep the spread.
- Self-serve at scale. Millions of advertisers transact through a console without ever speaking to a salesperson. This is the part leaders underweight, and it is the real moat. (More below.)
- On-platform measurement. You are, in effect, both the scorekeeper and the player. That is a commercial superpower and a trust liability in the same sentence — hold that tension; we return to it in the chapters on measurement and currency.
| Dimension | Open web | Walled garden |
|---|---|---|
| Data | Third-party cookies/IDs, licensed segments, degrading | First-party, logged-in, observed directly |
| Auction | RTB across many SSPs/exchanges, second-price norm | One proprietary first-price-style ranked auction you design |
| Demand | Fragmented across DSPs/agencies | Pooled in your self-serve console |
| Inventory | Other people’s pages | Owned-and-operated surfaces |
| Measurement | Stitched from many vendors, partial | On-platform, closed loop, self-reported |
| Margin | Leaks at every hop | Captured end-to-end |
| Control | Shared across the supply chain | Concentrated in one firm |
| Key risk | Signal loss, fraud, transparency gaps | Concentration, dependence, antitrust |
Figure 1.2 — Open web vs. walled garden across the dimensions a leader actually owns. Read the last two rows together: every advantage in the “margin” and “control” rows is mirrored by an exposure in the “risk” row. The garden does not eliminate risk; it concentrates it in you.
The flywheel is the business
If a board takes one mental model away, make it this one. A garden is not a pile of inventory; it is a flywheel. Users show up for the product and spend time. That time generates first-party data. The data improves ad relevance and prediction. Better relevance lifts advertiser ROI. Better ROI pulls in more budget. More budget funds the product and the model investment that brings more users and more time — and the wheel turns again, a little faster each rotation.
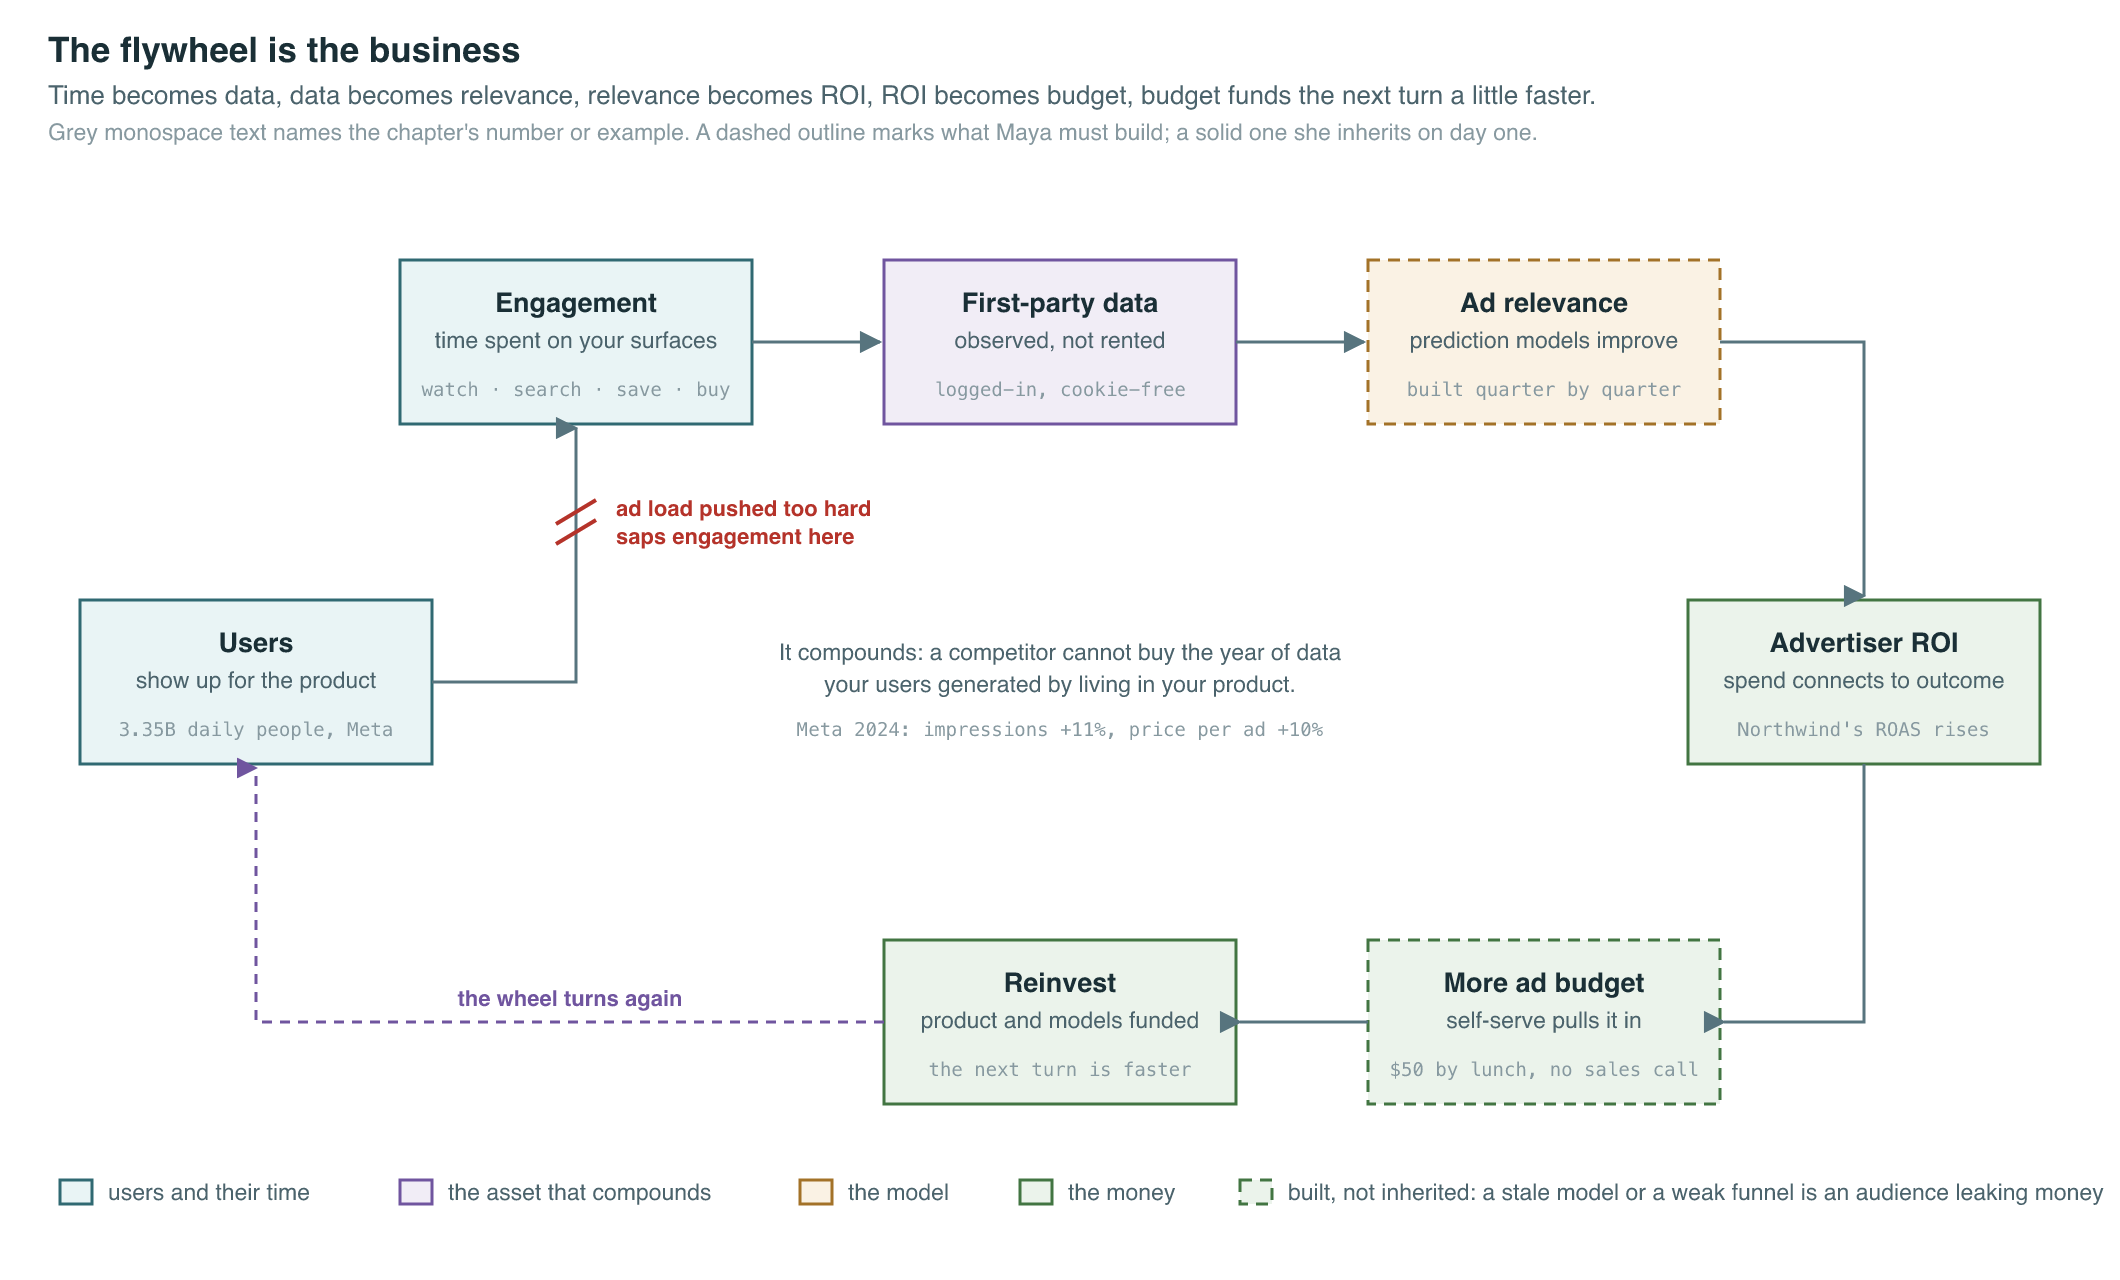
Figure 1.3 — The platform monetization flywheel. Each arrow is a place a leader can either accelerate the wheel or break it. Push ad load too hard and you sap engagement, starving the data that feeds the next turn. The whole rest of this book is the discipline of turning this wheel without snapping it.
Two things make the flywheel defensible rather than merely nice. First, it compounds: a competitor cannot buy a year of the data your users generated by living in your product. Second, self-serve at scale is what lets the wheel turn at billions of advertisers’ worth of demand without an army of salespeople. When any small business can open Meta Ads Manager, Google Ads, Amazon’s console, or TikTok’s Smart+ and spend $50 by lunch, the demand side compounds as automatically as the data side. Self-serve is the moat because it removes the human bottleneck from the most leverageable part of the loop.
This is also where you must be honest about what you inherit versus build. Maya inherits the users and the inventory on day one. She does not inherit a perfectly tuned relevance model or a frictionless self-serve funnel — those are built, quarter by quarter, and a flywheel with a weak self-serve funnel or a stale model is just a big audience leaking money. Knowing which arrows are strong and which are aspirational is the difference between a credible board narrative and a fairy tale.
Why leaders prize the garden — with the numbers
The reason this model is coveted is that it shows up in the financials at a scale the open web rarely matches. Treat these as audited company-reported figures for FY2024, and note they move.
- Google / Alphabet: FY2024 total revenue $350.0B (up 14% YoY), of which Google advertising was $264.6B — the majority of the company. YouTube ads alone were $36.15B for the year, with a record $10.47B in Q4 (Alphabet Q4/FY2024 results, Feb 2025). This is demand, auction, inventory, identity, and measurement under one roof at the largest scale that exists.
- Meta: FY2024 revenue $164.50B (up 22%), overwhelmingly advertising; Q4 ad revenue roughly $46.8B. The full-year ad engine moved on two levers a leader will obsess over: impressions up 11% and average price per ad up 10% (Meta Q4/FY2024 results, Jan 2025). Family Daily Active People hit 3.35 billion in December 2024 — the concentration that powers the flywheel and the concentration risk in one number. Worldwide ad ARPU reached roughly $56.7 in 2024, its highest ever (Statista citing Meta filings, 2025).
- Amazon: advertising services revenue $56.2B in 2024 (up 18%), crossing $50B for the first time and holding the #3 spot, with management framing an exit run-rate near $69B (Amazon Q4 2024 results, Feb 2025). This is the retail-media closed loop — purchase data plus owned inventory — and it is the fastest-growing of the giants.
Stack the Big 3 and you get the single fact that frames your job: Alphabet ($264.6B ad), Meta (~$160B+ ad), and Amazon ($56.2B) together command well over $480B in annual advertising (company FY2024 filings, aggregated). Zoom out to the whole market and walled gardens capture roughly 64–70% of US digital ad spend — eMarketer commonly cites about 64% flowing to Google, Meta, and Amazon combined, with close to 70% of digital dollars landing in closed environments (eMarketer/Statista, 2024–2025; vendor-estimated, directional).
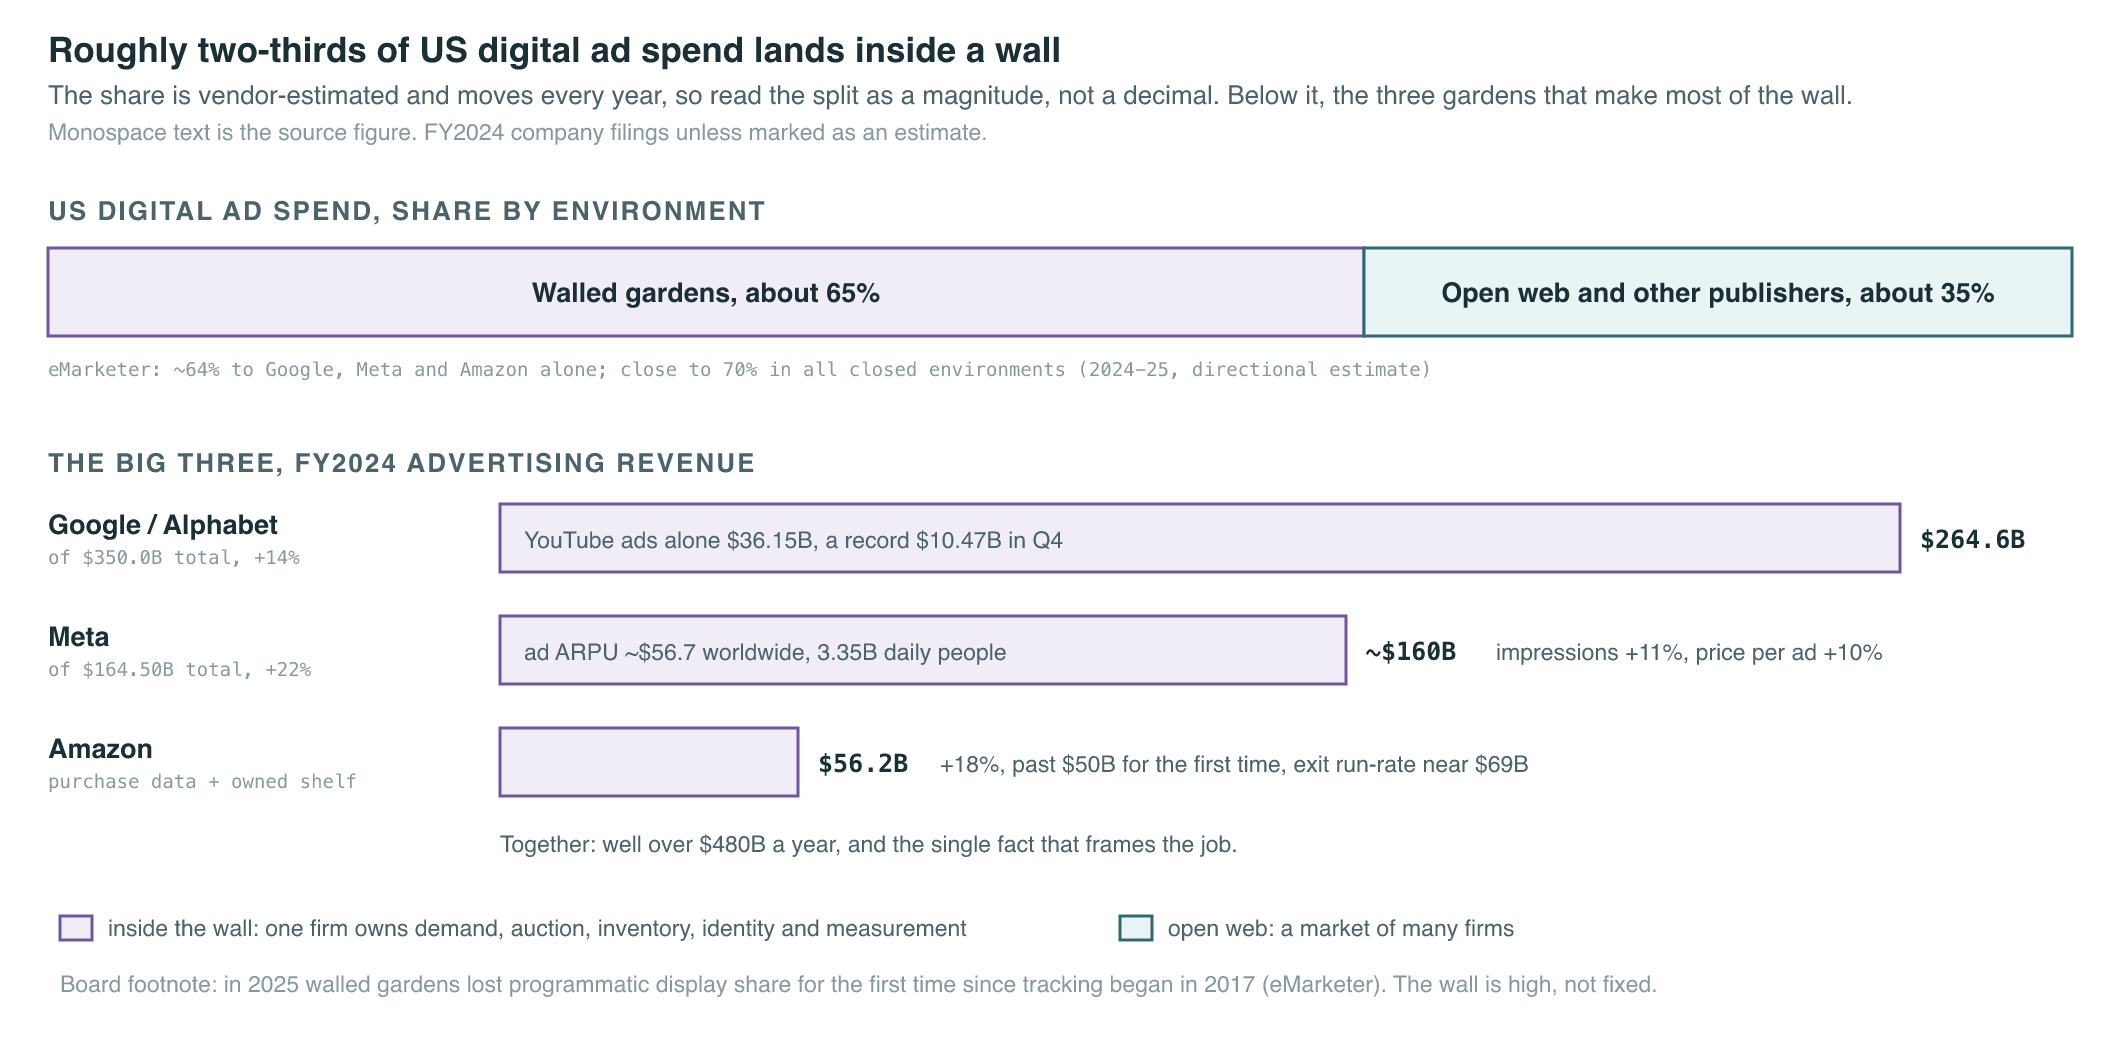
Figure 1.4 — Why the garden is coveted. Close to two-thirds of US digital ad spend flows through closed environments — eMarketer commonly puts about 64% with Google, Meta, and Amazon alone, and near 70% across all walled gardens. These shares are vendor-estimated and move year to year, so the slices here are rounded deliberately: anchor on “roughly two-thirds inside the wall,” not on a decimal. One countervailing signal worth carrying into board conversations: eMarketer reports that in 2025 walled gardens lost programmatic display share for the first time since it began tracking in 2017, even as US walled-garden programmatic display crossed $100B — the open web and CTV are clawing back a little ground (eMarketer, 2025).
The same lever, scaled down
Not every garden has 3 billion users, and the most useful learning for a leader often comes from the smaller and the specialized ones, because they show the flywheel under strain.
LinkedIn is the dominant B2B garden, built on professional first-party identity — job title, company, seniority, skills — that no consumer platform can match. Microsoft reported LinkedIn revenue around $16–17B in FY2024 (sources vary, roughly $16.4–17B; company/analyst-reported). Its closure is deep on identity but its inventory and formats are narrower; the lesson is that depth of first-party signal can substitute for breadth of audience.
TikTok is the fast-rising garden — short-form video plus TikTok Shop’s commerce loop, with US net ad revenue estimated near $12.3B in 2024 (eMarketer estimate; vendor-reported). It is also the cleanest illustration of regulatory exposure: its US future is clouded by divestiture-or-ban legislation. A garden whose entire national business can be legislated away is a garden with a wall someone else can knock down.
Among the mid-size gardens, the ARPU spread tells the strategy. Snap: FY2024 revenue $5.36B (up 16%), but Q4 global ARPU of just $3.44 against North America’s $9.73 — the same geo gap Maya knew at challenger scale, the difference between monetizing attention in a rich market and a growth one. Pinterest: $3.65B FY2024 revenue (up 19%), first $1B+ quarter, global ARPU $6.94, 553M MAU — a garden monetizing visual purchase intent. Reddit: newly public, ARPU around $4.21 in Q4 2024, ad revenue growing fast (up 56% YoY in Q3 2024) — a garden just learning to monetize community and interest data (Reddit Q3/Q4 2024 filings / Statista, 2025). (All Q4/FY2024 company results, early 2025.)
And then there is X — the cautionary tale you will hear referenced throughout this book. Analyst estimates put ad revenue at roughly $4.4–4.5B in 2022, falling to somewhere around $2–2.5B by 2024 as anchor advertisers fled over brand-safety and governance concerns (analyst/vendor estimates — eMarketer/WARC; X is private and does not report figures). X still had the users and the inventory; what it lost was advertiser trust. That is the lesson to tattoo on the inside of your eyelids: brand trust is not a soft value, it is revenue infrastructure, and it can evaporate faster than any flywheel can replace it.
Same-Lever Scorecard
The lever this chapter measures is degree of closure — how much of the demand → auction → inventory → identity → measurement loop the platform actually owns, and how deep its first-party signal runs.
| Platform | Owned demand (self-serve) | First-party data depth | Owned inventory | Degree of closure | Distinctive edge / exposure |
|---|---|---|---|---|---|
| Meta (incl. Instagram) | Very high — Ads Manager, Advantage+ | Very high — social graph, 3.35B DAP | High — feed, Reels, Stories | Near-total | Edge: scale + relevance. Exposure: concentration, signal-loss resilience |
| Google / YouTube | Very high — Google Ads | Very high — search + watch intent | Very high — Search, YouTube O&O | Near-total | Edge: intent + reach. Exposure: ad-tech antitrust ruling |
| Amazon | Very high — self-serve console | Very high — purchase data | High — retail + Prime Video | Very high | Edge: closed purchase loop. Exposure: retail-media commoditization |
| TikTok | High — Smart+, Symphony | High — engagement/interest graph | High — short-form feed | High | Edge: velocity + Shop. Exposure: divestiture/ban risk |
| High — Campaign Manager | High but narrow — professional identity | Medium — feed, narrow formats | High (deep, narrow) | Edge: B2B identity. Exposure: limited inventory/formats | |
| Reddit (wildcard) | Growing — self-serve maturing | Medium — interest/community signal | Medium — feed + comments | Moderate, rising | Edge: intent communities. Exposure: early monetization, scale |
Figure 1.5 — Same-Lever Scorecard: degree of closure. Note that “near-total” closure (Meta, Google) and “deep but narrow” closure (LinkedIn) are both defensible — there is more than one way to win the lever. The wildcard, Reddit, shows the lever mid-construction: the audience and the data exist, but the self-serve funnel and the closed loop are still being built. That is the difference between inheriting closure and earning it.
FIGURE 1.6 (spec): A conceptual illustration of a row of walled gardens seen from above — each a distinct enclosed plot bounded by a high wall. Inside each wall, three labeled beds grow together: Data, Auction, Measurement, with a single gate marked “Self-serve” as the only way in or out. Outside the walls, an open, unfenced commons (labeled “Open web”) where the same three crops grow scattered and trampled, tended by many different hands. One garden’s wall has a visible crack labeled “regulation / divestiture”; another’s gate is jammed open with advertisers walking out, labeled “trust.” Caption: Every garden controls its own data, auction, and measurement behind one wall — and every wall has exactly one failure mode worth watching. Alt-text: Aerial illustration contrasting enclosed walled gardens, each containing data/auction/measurement beds with a single self-serve gate, against an open trampled commons representing the open web; cracks and open gates depict regulatory and trust risk.
Decision or Diagnostic?
A leader has to keep the board-altitude metrics separate from the instrumentation an IC lives in. Conflating them is how a leader either drowns the board in detail or starves a team of it.
| Decision (board-level — you own these) | Diagnostic (IC-level — your teams own these) |
|---|---|
| ARPU / ARPP — per-user monetization, the flywheel’s output | Estimated action rate, predicted CTR per impression |
| Degree of closure — how much of the loop you own | Single-campaign ROAS, individual auction win rate |
| Walled-garden share of category spend — your structural position | EMQ (event-match quality — how well a conversion event matches a known user) on a given integration |
| Advertiser trust / concentration of demand — the X risk | Quality Score on one ad, model-prediction calibration |
| Privacy & regulatory posture — your right to operate | Specific clean-room query latency, signal-coverage rates |
Figure 1.7 — Sorting this chapter’s metrics. If a number changes how you allocate capital, set ad load, or talk to a regulator, it is a Decision metric. If it changes how an engineer tunes a model or an account manager fixes one campaign, it is a Diagnostic. The leader’s failure mode is managing the right-hand column and reporting the left-hand one upside down.
Northwind and the dependence problem
Now turn the loop around and look at it from the advertiser’s side, because that is the view Maya can never afford to lose. Northwind is a large global commerce advertiser — a DTC-plus-B2B hybrid — and a meaningful line in Maya’s revenue. Throughout this book you will see Northwind only from the platform side: how Maya’s choices change what Northwind spends, how much it trusts the garden, and how close it is to defecting.
Here is Northwind’s dilemma, which is the mirror image of Maya’s advantage. Everything that makes the garden great for Maya makes Northwind dependent. The closed loop means Northwind cannot fully verify the measurement; it has to trust Maya’s scorekeeping. The first-party data Northwind benefits from is data it does not own and cannot take with it. The self-serve console that makes spending easy also makes the platform the only place that performance exists. The better the garden performs, the more of Northwind’s budget concentrates inside it — and the more nervous Northwind’s CFO gets about depending on a single landlord who is also the referee.
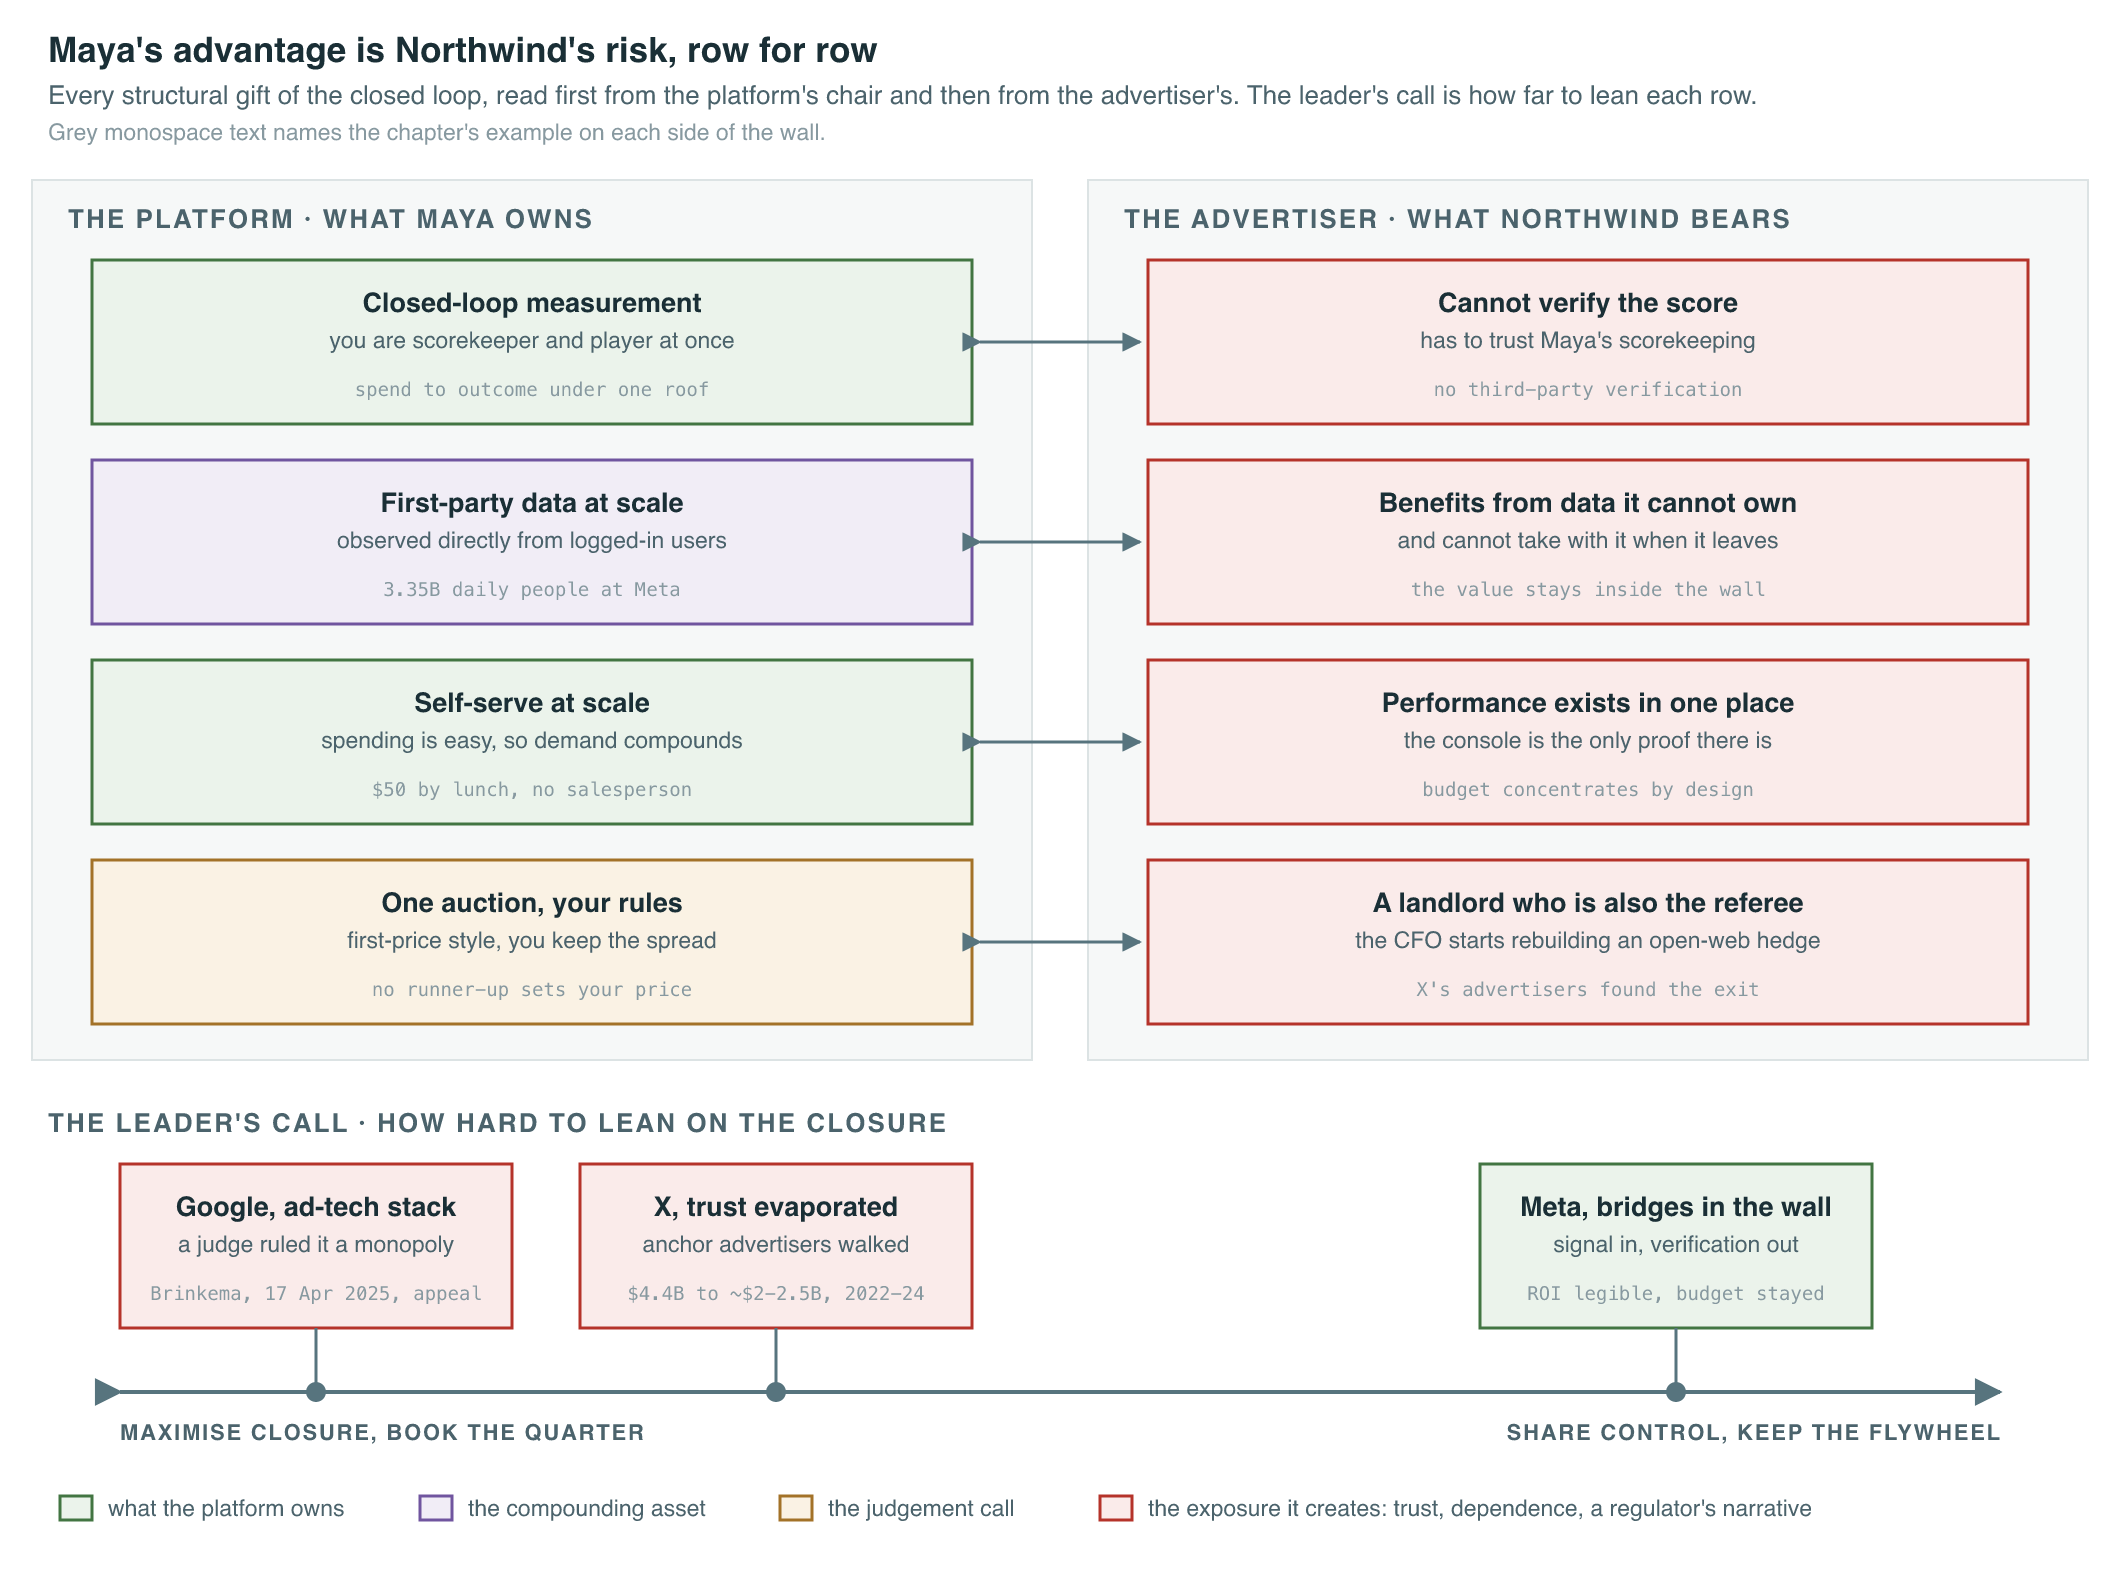
That tension is the chapter’s whole point. Maya’s structural advantage is Northwind’s structural risk. Every call Maya makes in the next eighteen months either eases that tension — earning Northwind’s trust and more of its budget four quarters out — or tightens it until Northwind starts rebuilding an open-web hedge and looking for the exit. X’s advertisers found the exit. Maya’s job is to make sure Northwind never has a reason to look for it.
The leader’s call. You own one trade-off above all in this chapter: how aggressively to monetize the closure you control versus how visibly to share control with the advertisers who depend on it. Pull every lever inward — opaque measurement, no third-party verification, data that never leaves — and you maximize short-run margin and minimize Northwind’s leverage. But you also maximize Northwind’s anxiety and hand a regulator their narrative. Meta resolved this by leaning into the closed loop while building advertiser-facing bridges that let outside signal flow in and partial verification flow out — keeping ROI legible enough that budget stayed and trust held even through the signal-loss shock. Google sits at the other pole: it pushed closure and integration so hard across the ad-tech stack that on April 17, 2025, a US federal judge (Brinkema) ruled it illegally monopolized the publisher-ad-server and ad-exchange markets, with a remedies phase that opened in September 2025 and a possible breakup on the table (fast-moving litigation; Google is appealing). Same lever, opposite resolutions. Four quarters out: the leader who shares just enough control to keep advertiser trust and stay ahead of regulators compounds ARPU on a flywheel that keeps turning; the leader who maximizes closure books a better next quarter and inherits the X problem or the Brinkema problem — a trust collapse or a forced un-bundling that no amount of first-party data can outrun.
Key terms
| Term | One-line definition |
|---|---|
| Walled garden (O&O ad business) | A platform where one company owns the inventory, the auction, the identity data, and the measurement. |
| Closed loop | The same company sees the ad served and the resulting action, so spend connects to outcome without third-party stitching. |
| Proprietary single auction | One platform-designed, first-price-style ranked auction — not RTB bid across many SSPs at a second price. |
| Self-serve at scale | Millions of advertisers transacting through a console with no salesperson — the structural moat that compounds demand automatically. |
| Platform monetization flywheel | Users → engagement → first-party data → ad relevance → advertiser ROI → budget → reinvestment, compounding each turn. |
| Degree of closure | How much of the demand→auction→inventory→identity→measurement loop a platform actually owns. |
| First-party data | Data the platform observes directly from its own logged-in users — not licensed, not cookie-dependent. |
| ARPU | Average revenue per user — total ad revenue divided by a user count (e.g., Meta’s ~$56.7 worldwide ad ARPU, Snap, Pinterest, Reddit). The board-level read on per-user monetization. |
| ARPP | Average revenue per person — a related but distinct metric on a different denominator (e.g., Meta’s Family ARPP, ~$13.65 in Q2 2025, spans the de-duplicated Family of apps). Not interchangeable with ARPU — different bases; never compare the two numbers directly. |
Recap & what is next
- The open web is a market of independent firms relaying one impression through five or six hops; a walled garden is a firm that has internalized the whole market into one closed loop.
- Owning demand, auction, inventory, identity, and measurement together buys first-party data at scale, a proprietary auction whose rules and spread you keep, self-serve at scale, and on-platform measurement — the sources of margin and defensibility.
- The flywheel — users → engagement → data → relevance → ROI → budget → reinvest — is the actual business; self-serve at scale is the moat that lets it compound. Know which arrows you inherit and which you must build.
- The model shows up in the financials: Alphabet, Meta, and Amazon command well over $480B in combined ad revenue (FY2024), and walled gardens capture roughly two-thirds of US digital ad spend (eMarketer, directional, 2024–25).
- Every advantage is mirrored by a liability: audience concentration, advertiser dependence (Northwind), antitrust and regulatory exposure (the 2025 Google ad-tech ruling; TikTok’s divestiture risk), and the fragility of advertiser trust (X’s estimated slide from ~$4.4B to ~$2–2.5B; analyst figures, X is private).
- The leader’s call is how aggressively to monetize closure versus how visibly to share control — and the four-quarters-out consequence lands on ARPU and advertiser trust together.
You now own the P&L, but you have not yet looked at how it is actually built. Chapter 2 — The Job You Just Inherited takes you inside it: monetization as the price × volume problem (revenue = ad load × yield), and the central tension you will manage for the rest of the book — pushing yield and ad load for this quarter’s revenue against the user engagement that feeds long-run ARPU. That is the lever the flywheel hands you on day one.