The promise. Chapter 2 handed you the first-order P&L lever: grow next year on volume (more ad load) or price (more yield), and own the retention risk each carries. This chapter zooms out to the map that tells you where to pull those levers. Because price and volume are not evenly distributed across your platform — they pool. They pool in certain geographies and on certain surfaces, and the pools differ by more than an order of magnitude. By the end of this chapter you will be able to read your own revenue the way the best operators do — by profit pool, not by headcount — and decide which pools to fund (invest in demand, auction sophistication, and measurement to build pricing power) versus harvest (monetize the reach you already have). You will also be able to do the harder political work: walk into the board room and reframe the growth story from “users up and to the right” to “monetizable engagement up and to the right” — and know exactly how much revenue you can let concentrate in one rich geography before that concentration becomes a regulatory single point of failure.
You will be able to:
- Read your platform’s revenue as a grid of profit pools — geography × surface — and explain why a user in one cell is worth 16x a user in another.
- Decide which geos and surfaces to fund for demand density and pricing infrastructure versus harvest for reach.
- Defend a board narrative built on monetizable-engagement growth rather than raw user-count growth.
- Reason about demand density as a constructed asset — built from advertiser acquisition, auction sophistication, and measurement — not a gift of having an audience.
- Quantify the revenue-concentration risk in your highest-ARPU geography and set a tolerance before it becomes a privacy/regulatory failure mode.
Builds on: Book 2 ch1 (the closed loop and the monetization flywheel) and ch2 (the price × volume P&L); Book 1 ch5 (the yield curve and demand density). Hands off to: Part II, where the auction and ML stack that actually build the pricing power discussed here are engineered.
The map that should be on your wall: revenue is not where the users are
Maya’s second board deck arrived with a slide her predecessor had used for three years: monthly active users by region, a reassuring set of bars climbing left to right, with the tallest bars in Asia-Pacific and the “Rest of World” bucket. The implicit story: we are winning, because we are adding the most people where the most people live.
It is the wrong story, and Maya’s job in her first quarter is to retire it.
Here is why. ARPU — average revenue per user, the per-head monetization rate that is your single most-quoted efficiency number — is not remotely uniform across the world. Meta reports a close cousin it calls ARPP (average revenue per person, deduplicated across its app family). For full-year 2024 (Meta Q4 2024 earnings, filed 2025), the spread looks like this:
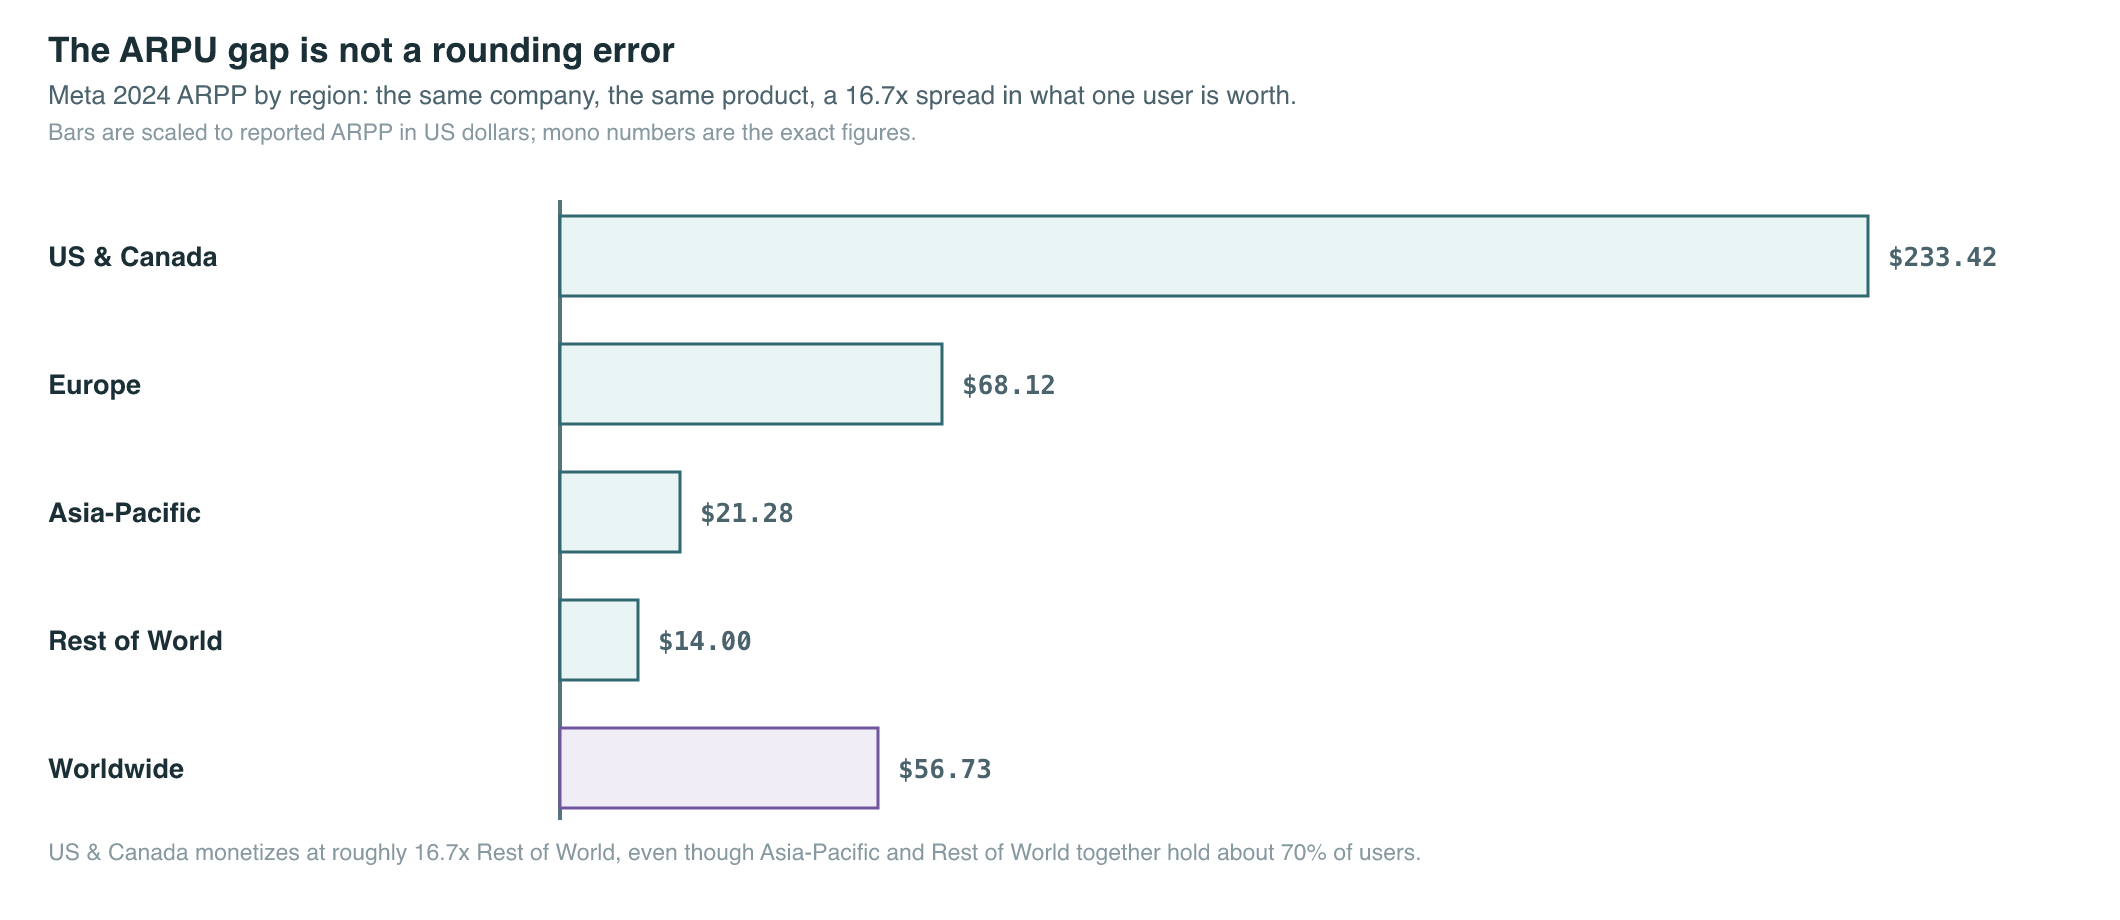
A user in the US & Canada generated $233.42 in 2024. A user in Rest of World generated roughly $14. That is a ~16.7x gap — and it is the single most important fact a monetization leader must internalize: users are not fungible revenue. You cannot average them. You cannot promise the board that the APAC and RoW user bars — which together are roughly 70% of Meta’s users — will “eventually” monetize like North America. The gap is structural, and we will see why in a moment.
The same shape repeats across every platform, just at different absolute altitudes:
- Snap (Q4 2024 investor letter, 2025): global ARPU $3.44, but North America $9.73 — several times the global rate.
- Pinterest (Q4 2024 earnings, 2025): the gap is extreme — US & Canada ARPU $9.00 versus Rest of World $0.19. That is roughly 47x. Pinterest’s hundreds of millions of international users are, in revenue terms, almost a rounding error today.
The pattern is not “rich platforms monetize better.” It is that within every platform, a tiny set of geographies holds most of the money. The board slide should not be a population map. It should be a profit-pool map — revenue, not users, by cell.
FIGURE 3.2 (spec): A heatmap titled “Where the money actually lives.” Rows = surfaces (Feed, Stories/Reels, Search, Video, Messaging, Commerce/PDP). Columns = geographies (US & Canada, Europe, APAC, RoW). Each cell shaded by revenue intensity (revenue per thousand impressions × impression volume), deep red = dense pool, pale = thin. The visual punchline: the deepest-red cells cluster in a small corner (US/Europe × Feed/Search/Commerce), while the largest user counts sit in pale cells (APAC/RoW × Reels/Messaging). Caption: “User density and revenue density are nearly inverse. Steer to the red.” Alt-text: “Heatmap showing revenue concentrated in a few high-intent surface-geography cells despite users concentrated elsewhere.”
Why the gap exists: demand density, and the fact that it is built
A leader who stops at “North America is richer” will draw the wrong conclusion — usually some version of “let’s acquire more North American users,” which is the most expensive and least available growth on earth. The deeper question is why a North American impression clears at 16x. The answer is demand density: how many qualified advertisers are competing in the auction for each impression.
This is the concept Book 1 ch5 develops as the engine of the yield curve, so I will not re-derive the mechanics. At leader altitude, the one thing to hold is this: price is set by competition for the impression, not by the impression itself. Two identical users — same age, same interests, same time spent — will clear at wildly different prices if one sits in an auction with 40 bidding advertisers and the other in an auction with three. eCPM is a function of competition, and competition is a function of how many advertisers find it worthwhile to show up.
And here is the part most operators get backwards: demand density is constructed, not given. It is the output of three investments you control:
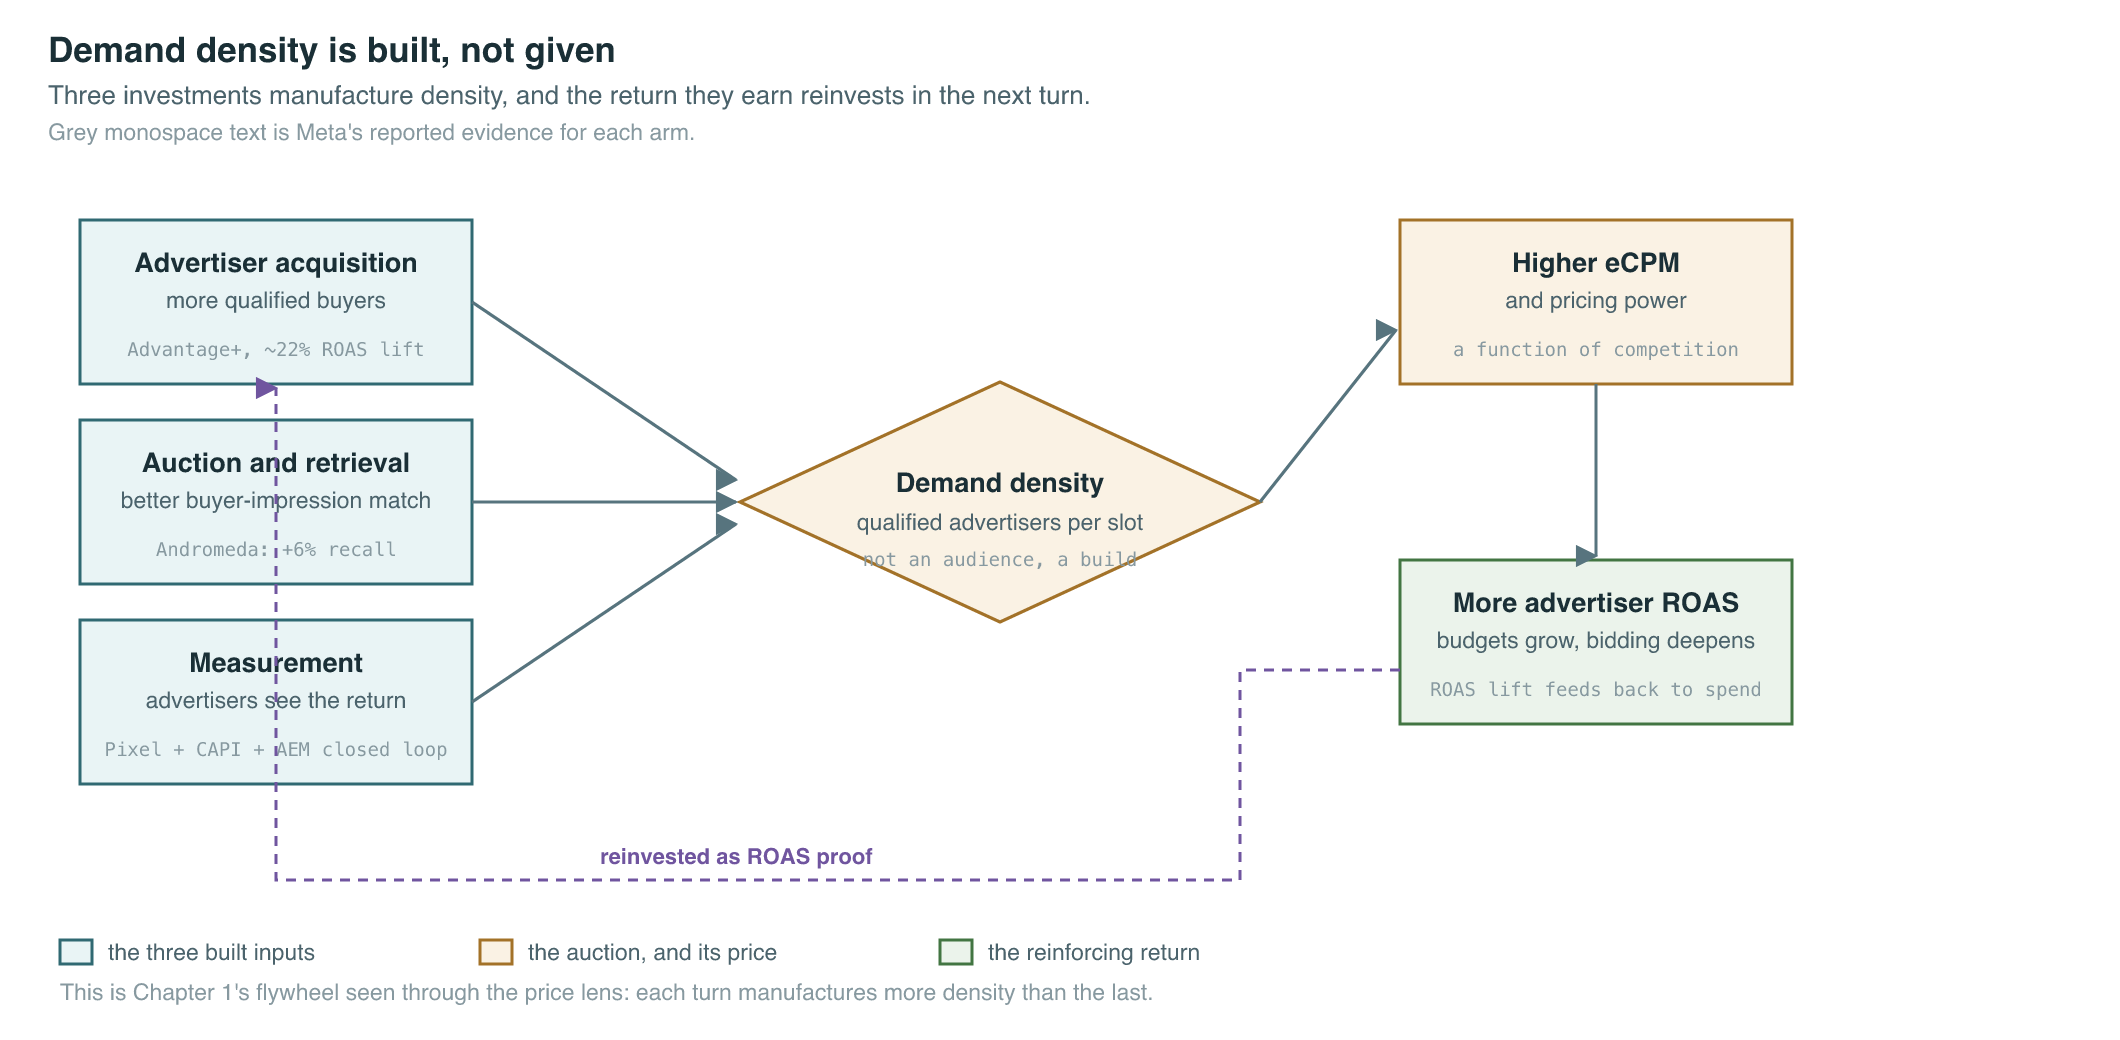
Figure 3.3 — Demand density is an output you build, not an audience you have. The loop is the flywheel of Chapter 1, viewed through the price lens.
Each arm is a real, fundable lever, and Meta has put numbers on all three:
- Retrieval and ranking — the engine that decides which ads even get considered for an impression. Meta’s Andromeda retrieval engine (Engineering at Meta, Dec 2024) reported +6% recall and +8% ads quality on select segments; its Lattice ranking work reported ~10% metric gains and ~6% conversion improvement. Better matching means each impression draws a denser, more relevant set of bids — density manufactured by ML.
- Advertiser acquisition via automation — lowering the skill and budget barrier so more advertisers can run profitably. Advertisers new to Advantage+ creative saw ~22% higher ROAS (Meta / industry coverage, 2024–2025, vendor-reported), and Meta cut the Advantage+ qualification threshold from 50 to 25 conversions/week — literally widening the door so more buyers qualify to compete.
- Measurement — the closed loop of Pixel + CAPI + AEM (Book 1 ch4, ch7) that lets an advertiser see the return and therefore bid with conviction. An advertiser who cannot measure outcomes bids timidly or not at all; that is a thin auction by another name.
The strategic consequence: when Maya looks at her ~16x geo-gap, the right reading is not “those users are worth less.” It is “we have not yet built the demand density in those auctions.” The RoW impression is cheap because few advertisers can target it confidently, measure it, or find it through the retrieval stack — not because the human is intrinsically worthless. That reframe is the whole game, because built things are investable, while given things are just accepted.
It also explains a fact that should reassure the board where the user-count slide alarmed it: Meta’s lowest-ARPU regions are growing revenue fastest. 2024 revenue growth ran +18% US & Canada, +26% Europe, +22% APAC, and +31% Rest of World (Meta Q4 2024, 2025). The monetization expansion is happening precisely where density is being built from a low base. The user-count narrative misses this entirely; the density narrative captures it exactly.
Surface matters as much as geography — and engagement can be revenue-dilutive
Geography is one axis of the profit-pool grid. The other — equally important, more often neglected — is surface: where on your platform the impression sits. Feed, Stories, Reels (short-form video), Search, long-form video, messaging, commerce/PDP. These are not interchangeable inventory; they carry radically different demand density and pricing power for the same user in the same country.
The cleanest live example is the Reels-vs-Feed dynamic inside Instagram. Reels (short-form video, the TikTok-style surface) rose from 35% of Instagram ad load in Q4 2024 to 53% in Q4 2025 (eMarketer, 2025) — a majority of impressions. Yet Reels still monetizes at a lower rate per impression than Feed. Meta leadership has been explicit that this is a monetization-efficiency problem, not just a mix shift: engagement migrating from a high-yield surface (Feed) to a lower-yield one (Reels) can be revenue-dilutive even as total engagement and time-spent rise (Meta earnings commentary via eMarketer/AInvest, 2024–2025, medium confidence). In their own framing, growing Reels initially “loses money” because it takes time away from a surface that monetizes better.
Sit with that, because it is the single most counterintuitive idea in this chapter: more engagement can mean less revenue. A leader optimizing for time-spent — a metric every product team loves — can actively erode ARPU by shoveling attention onto an under-monetized surface. This is why “monetizable engagement” and “engagement” are different KPIs, and why the gap between them is a leadership responsibility, not a product-team afterthought.
The surface axis cuts the other way too, in your favor. Some surfaces are intrinsically dense because they sit on top of intent:
- Search carries declared commercial intent, so demand stacks deep. Google’s FY2024 Search & Other revenue was $198.1B versus YouTube ads at $36.1B (Alphabet Q4 2024 results, 2025). Same company, same users, one surface monetizes ~5.5x the other — because Search captures a person at the moment of stated demand, and that moment draws the densest auction in advertising.
- Commerce surfaces (the product detail page, retail search) are intent made literal. Amazon built an entirely new high-density profit pool here: $56.2B full-year 2024 ad revenue, Q4 +18% YoY, ~$69B run-rate (Amazon Q4 2024 / AdExchanger / Variety, 2025). US retail media is the fastest-growing channel in advertising — +20.4% in 2024 to $52.3B, forecast >$62B in 2025 (eMarketer, 2025, forecast). Purchase intent is the densest demand signal there is.
So the grid has a clear gradient. The deepest pools sit at the intersection of a rich geography and an intent-laden surface. The thinnest sit at the intersection of a developing geography and an attention-only surface. Your engagement might be booming in the second cell while your revenue lives in the first.
The fund-vs-harvest call
Now the decision this chapter actually equips. You cannot fund everything; pricing infrastructure — demand teams, auction R&D, measurement integrations, sales coverage — is expensive and finite. So every geo × surface cell gets sorted into one of two strategies:
- Fund — invest to build demand density and pricing infrastructure. Justified where the pool is large or strategic and density is currently below its ceiling, so investment moves price. You are buying a higher yield curve.
- Harvest — monetize the reach you already have with existing infrastructure, at whatever yield the current density supports. Justified where the pool is structurally thin, or where density is already near its ceiling and further investment would not move price much.
The test is not “where is ARPU highest today” (that just tells you to harvest North America forever). The test is marginal return on density investment: where does another dollar of demand/auction/measurement spend move eCPM the most? That is usually not the richest cell, because the richest cell is often already saturated with demand.
| Cell (geo × surface) | Pool size | Current density | Headroom to build | Call |
|---|---|---|---|---|
| US/CA × Search/Commerce | Very large | Very high | Low (near ceiling) | Harvest — defend, optimize, raise floors |
| US/CA × Feed | Large | High | Moderate (automation, creative AI) | Fund selectively — incremental yield via ranking/automation |
| Europe × Feed/Commerce | Large, rich | High | Moderate — but regulatory ceiling (see next section) | Fund cautiously — hedge the legal risk |
| US/CA × Reels/short-form | Large reach | Low (per-impression) | High — yield gap vs Feed is the prize | Fund — close the surface gap, this is dilutive until you do |
| APAC/RoW × Feed | Huge reach | Low | High — fastest revenue growth lives here | Fund — build demand from a low base |
| APAC/RoW × Reels/Messaging | Huge reach | Very low | Long-horizon | Harvest — monetize reach cheaply, fund later |
| B2B intent (LinkedIn-type) | Mid, premium | High & defensible | Moderate | Fund — specialization is moat |
Table 3.1 — Fund vs harvest, by representative cell. The pattern: fund the under-monetized surface in a large geography (US Reels), fund the low-density surface in a fast-growing geography (APAC Feed), and harvest the saturated rich cells and the structurally thin ones.
Two cells deserve a leader’s special attention. First, US Reels — large reach, low per-impression yield, high headroom. This is the most fundable cell on most consumer platforms right now precisely because it is dilutive until you build its density. Closing the Reels-to-Feed yield gap is worth more than chasing a new geography. Second, APAC/RoW Feed — where the fastest revenue growth already lives (Meta’s +31% RoW). Funding density from a low base compounds.
The wildcard lesson sits in the platforms still early on this curve. Reddit — a large, distinctive engagement surface — ran only ~$1.19B in 2024 ad revenue (Statista/AdExchanger, 2024–2025, estimate) because demand density and ad infrastructure were immature; as it scaled performance-ad infrastructure, quarterly ad revenue later grew ~75% YoY. The engagement was always there. The demand density had to be built. TikTok is the same story at scale: ~$23.6B global ad revenue in 2024, +~40% YoY (Statista/Business of Apps, estimate), yet its US per-user monetization still trails incumbents — a vast engagement base that has not yet fully converted to monetizable engagement. Enormous reach is the precondition for a profit pool, never the pool itself.
The hidden risk: a rich geography is a single point of failure
There is a sting in the tail of the geo-gap, and a leader who ignores it will be blindsided. If one geography holds a wildly disproportionate share of your revenue, then anything that disrupts monetization in that one geography disrupts your whole P&L — and the most likely disruptor is not a competitor. It is a regulator.
Concentration is a privacy/regulatory single point of failure. The richer the pool, the bigger the blast radius, and rich pools are exactly where privacy regimes bite hardest — because high ARPU is built on the data combination and personalization that privacy law most wants to constrain.
Europe is the live case (and the figures here are fast-moving and legal — verify before you cite). Europe is Meta’s second-richest pool: ARPP $68.12 in 2024, ~4.9x Rest of World (Meta Q4 2024, 2025). In April 2025 the European Commission issued a Digital Markets Act non-compliance finding on Meta’s “pay or consent” model, with a €200M fine (European Commission / ITIF / Fortune, 2024–2025, medium confidence, fast-moving). DMA fines can reach 10% of global annual revenue — 20% for repeat offenses. The threat is not the fine. The threat is a forced change to how data is combined and personalization is done in a high-ARPU region — a structural hit to the very mechanism that makes that pool dense.
This is the strategic content of X’s collapse, our recurring cautionary tale (~$4.4B 2022 → ~$2.5B 2024): brand trust is fragile revenue infrastructure, and X concentrated its exposure in advertisers who could leave in unison. Regulatory concentration is the same fragility wearing a different hat — a correlated risk sitting under a pool you depend on.
So a third decision lands on Maya’s desk alongside fund-vs-harvest and the board narrative: how much revenue concentration in one high-ARPU geography will you tolerate before treating it as a risk to be actively diversified? There is no universal number, but the disciplines are clear:
- Measure the concentration explicitly — what share of revenue (and of profit) sits in your single most-exposed geo, and how correlated is it to one regulatory regime?
- Stress-test it — model a forced personalization downgrade in that geo (Book 1 ch4’s privacy mechanics) and see what it does to group ARPU.
- Fund diversification as a hedge — the fastest-growing pools (APAC/RoW) double as your regulatory hedge. Funding density there is not only growth; it is risk reduction. The fund-vs-harvest map and the concentration map are the same map.
Same-Lever Scorecard
How exposed is each platform on geo-mix dependence and top-geography revenue concentration — and how is each resolving the fund-vs-harvest call?
| Platform | Geo-mix dependence | Top-geo concentration | Fund-vs-harvest posture |
|---|---|---|---|
| Meta | ~16.7x US/CA-vs-RoW ARPP gap (2024); 70% of users in low-ARPU APAC+RoW | High; Europe ($68 ARPP) is a regulated #2 pool | Fund density everywhere via Andromeda/Lattice/Advantage+; close Reels yield gap; build RoW from low base |
| Surface-specialized (B2B intent), less geo-skewed; premium pool | Concentrated in US B2B (~$4.21B 2024; ~25% of US B2B spend) | Fund the specialization moat; harvest defensible B2B intent | |
| TikTok | Vast global engagement, US/per-user monetization lags (~$23.6B global 2024 est.) | Acute US regulatory/ownership risk on a key pool | Fund US density (Smart+, Symphony) + TikTok Shop commerce intent |
| Google/YouTube | Search ($198.1B) dwarfs YouTube ads ($36.1B) FY2024 — surface gap is the story | High intent-surface concentration in Search | Harvest Search saturation; fund YouTube/Shorts yield uplift |
| Amazon | Built a new dense pool on commerce intent ($56.2B 2024, +18%) | Retail-media demand concentrated (Amazon+Walmart 84.2% of US, 2024) | Fund the high-intent commerce pool aggressively; it is the densest demand there is |
| Pinterest (wildcard) | Extreme ~47x US/CA-vs-RoW gap ($9.00 vs $0.19, Q4 2024) | Revenue almost entirely US/CA; RoW is a rounding error | Harvest US; fund RoW density slowly (RoW +24% YoY off tiny base) |
Table 3.2 — Same-lever scorecard. Note the diversity of moats: Meta funds density at scale, LinkedIn funds surface specialization, Amazon funds a net-new intent pool. There is no single right cell to chase — only the right marginal-return discipline.
Decision or Diagnostic?
| Board-level Decision metrics | IC-level Diagnostic metrics |
|---|---|
| ARPU / ARPP by region (the geo-gap) | eCPM by individual surface/placement |
| Revenue share by surface (Feed vs Reels vs Search vs Commerce) | Per-impression yield delta Reels-vs-Feed |
| Monetizable-engagement growth vs raw-engagement growth | Auction depth (qualified bidders per impression) |
| Revenue concentration % in top geography (SPOF risk) | Andromeda recall / Lattice ranking lift |
| Triopoly / category revenue share (the real scoreboard) | Advantage+ qualification rate, single-campaign ROAS |
| Revenue growth by region (where expansion lives) | Measurement coverage (Pixel/CAPI/AEM match rate) |
Table 3.3 — Decision or diagnostic? The board tracks where the pools are, how fast they grow, and how concentrated the risk is. The IC tracks the density-building machinery. A leader who brings IC diagnostics to the board (or a user-count slide masquerading as a decision metric) has mis-sorted. Note especially: the US digital ad market is consolidating into a Google-Meta-Amazon triopoly (2024 US share ~25.6% / 21.3% / 13.9%, ~60.8% combined; eMarketer, mix of actuals/forecast) — share is the board scoreboard, not raw users.
The leader’s call
The trade-off Maya owns: she cannot fund density in every cell, and the cell with the highest ARPU today is usually the wrong place to invest the next dollar. She must steer scarce pricing-infrastructure investment toward cells with the most headroom — under-monetized surfaces in large geos (US Reels) and low-density surfaces in fast-growing geos (APAC Feed) — while harvesting the saturated rich cells and the structurally thin ones, and capping how much of the P&L she lets ride on any single regulated geography.
How a real platform resolved it: Meta funded demand density structurally rather than chasing users — Andromeda retrieval (+6% recall), Lattice ranking (~10% metric gains), and Advantage+ automation (~22% ROAS for new advertisers; threshold halved to widen the auction). The result shows up in the geo-growth figures: Rest of World grew revenue +31% in 2024 off a $14 ARPP base, faster than the rich North American pool — density built from a low base, not headcount harvested. Amazon ran the same play on a different axis, funding a net-new commerce-intent pool to $56.2B because purchase intent is the densest demand signal in advertising.
Four quarters out: a platform that funds density and reframes the board around monetizable engagement compounds ARPU and advertiser trust — advertisers see rising ROAS as auctions thicken, and the board sees a defensible share story. A platform that chases user count instead adds low-yield reach, dilutes ARPU (the Reels trap), and — if it leaves revenue concentrated in one regulated geo — carries a correlated single point of failure that one DMA ruling can detonate. The geo that grows your revenue and the geo that hedges your regulatory risk are, conveniently, the same geo. Fund it.
Key terms
| Term | One-line definition |
|---|---|
| Profit pool | A cell of revenue concentration defined by geography × surface; the unit a leader should manage, not users. |
| ARPU / ARPP | Average revenue per user / per person; the per-head monetization rate — wildly non-uniform across geos (~16.7x at Meta). |
| Demand density | The number of qualified advertisers competing per impression — the true driver of eCPM, and a constructed asset. |
| Monetizable engagement | Engagement on surfaces and in geos where demand density converts attention to revenue — distinct from raw time-spent. |
| Revenue-dilutive engagement | Engagement migrating to a lower-yield surface (e.g., Feed→Reels) that lowers blended ARPU even as total engagement rises. |
| Fund vs harvest | The capital-allocation call: invest to build density/pricing infrastructure (fund) vs monetize existing reach as-is (harvest). |
| Regulatory single point of failure | Revenue concentrated in one high-ARPU geography, so one privacy/regulatory ruling can disrupt the whole P&L. |
Recap & what is next
- Users are not fungible revenue. A ~16.7x US-vs-RoW ARPP gap (Meta 2024) means a user-count growth story is the wrong board narrative; manage profit pools (geo × surface), not headcount.
- Demand density is the true price driver — and it is built. eCPM is set by how many qualified advertisers compete per impression, and that competition is the output of advertiser acquisition, auction/retrieval sophistication, and measurement — all fundable levers.
- Surface matters as much as geography. Intent-laden surfaces (Search $198.1B vs YouTube $36.1B; Amazon commerce $56.2B) are intrinsically dense; attention-only surfaces (Reels) can be revenue-dilutive even as engagement climbs.
- Fund the headroom, harvest the rest. Invest density where the marginal return is highest — under-monetized surfaces in big geos, low-density surfaces in fast-growing geos — not where ARPU is already highest.
- Concentration is a single point of failure. Revenue piled in one high-ARPU regulated geography (Europe ARPP $68; €200M DMA finding, 2025, fast-moving) is correlated risk; the fastest-growing pools double as your regulatory hedge.
- Reframe the board story from user-count growth to monetizable-engagement growth, and track category share (the triopoly scoreboard), not raw users.
You now know where the money lives and which pools to fund. Chapter 4 — The Auction Is Your Policy — goes inside the machine that actually prices every one of these impressions, and the dials you turn on top of it to convert demand density into realized yield.