The promise. In Chapter 4 you learned to treat the auction as policy — the weights and reserves that decide whose ad wins. This chapter drops one altitude to the operational question underneath: given that policy and the models from Chapter 5, how do you actually steer price and volume across a quarter — the rate at which budgets spend, the floor under each impression, how many ads a user sees, and how often they see the same one? This is the yield layer: the daily machinery that turns a static price × volume P&L into a living one, smoothing demand across the day, defending clearing prices against thin auctions, and deciding how hard to push ad load before the engagement that feeds next year’s impressions starts to bend. You will leave able to read a pacing chart, a bid landscape, and an ad-load curve the way you read the P&L — and to own the calls no IC on the launch desk is authorized to make.
You will be able to:
- Decide where ad load sits on each surface relative to engagement, and how aggressively to expand it this year versus protect it.
- Reason about pacing — why budgets spend smoothly rather than all at 9am — and what demand-led pacing hands to the platform versus the advertiser.
- Defend reserve prices and bid-landscape management as deliberate yield tools, not friction, when demand is thin.
- Reason about frequency capping as a yield lever, not just a hygiene setting: the point where one more impression destroys more value than it creates.
- Distinguish the yield decisions you own (load, reserve policy, frequency posture) from the diagnostics the launch desk tunes (pacing curves, per-auction clearing prices, fill).
- Connect any one of these operational dials to its four-quarters-out effect on ARPU and advertiser trust.
Builds on: Book 1 ch5 (floors and the yield curve — how price responds as you sell more or less of your inventory). Book 2 ch2 (the price × volume P&L and the load-versus-engagement frontier), ch4 (the auction as policy: Total Value, reserves, autobidders). It is the operational sibling to ch4: ch4 set the policy; this chapter is how the policy is run, impression by impression, across a quarter.
The call on Maya’s desk
Q3 planning. Maya’s surfaces team brings two proposals and a worry. One: lift Reels ad load by adding a slot every N videos, modeled to add roughly two points of impressions. Two: raise reserve prices in three thin-demand Rest-of-World markets already clearing near the floor. The worry, from her head of marketplace health: a cohort of heavy users now sees the same three advertisers’ creatives four-plus times a day, and complaint rates are climbing.
Three decisions, one chapter. Each is a yield decision — a steering input on price or volume an IC could implement but only the leader can authorize, because each trades visible near-term revenue against a diffuse, later cost to engagement or trust. The ad-load bump is pure volume. The reserve hike is pure price. The frequency problem is where volume quietly turns negative — where the next impression subtracts value. Maya’s job is not to run these dials but to set where they sit and defend the settings.
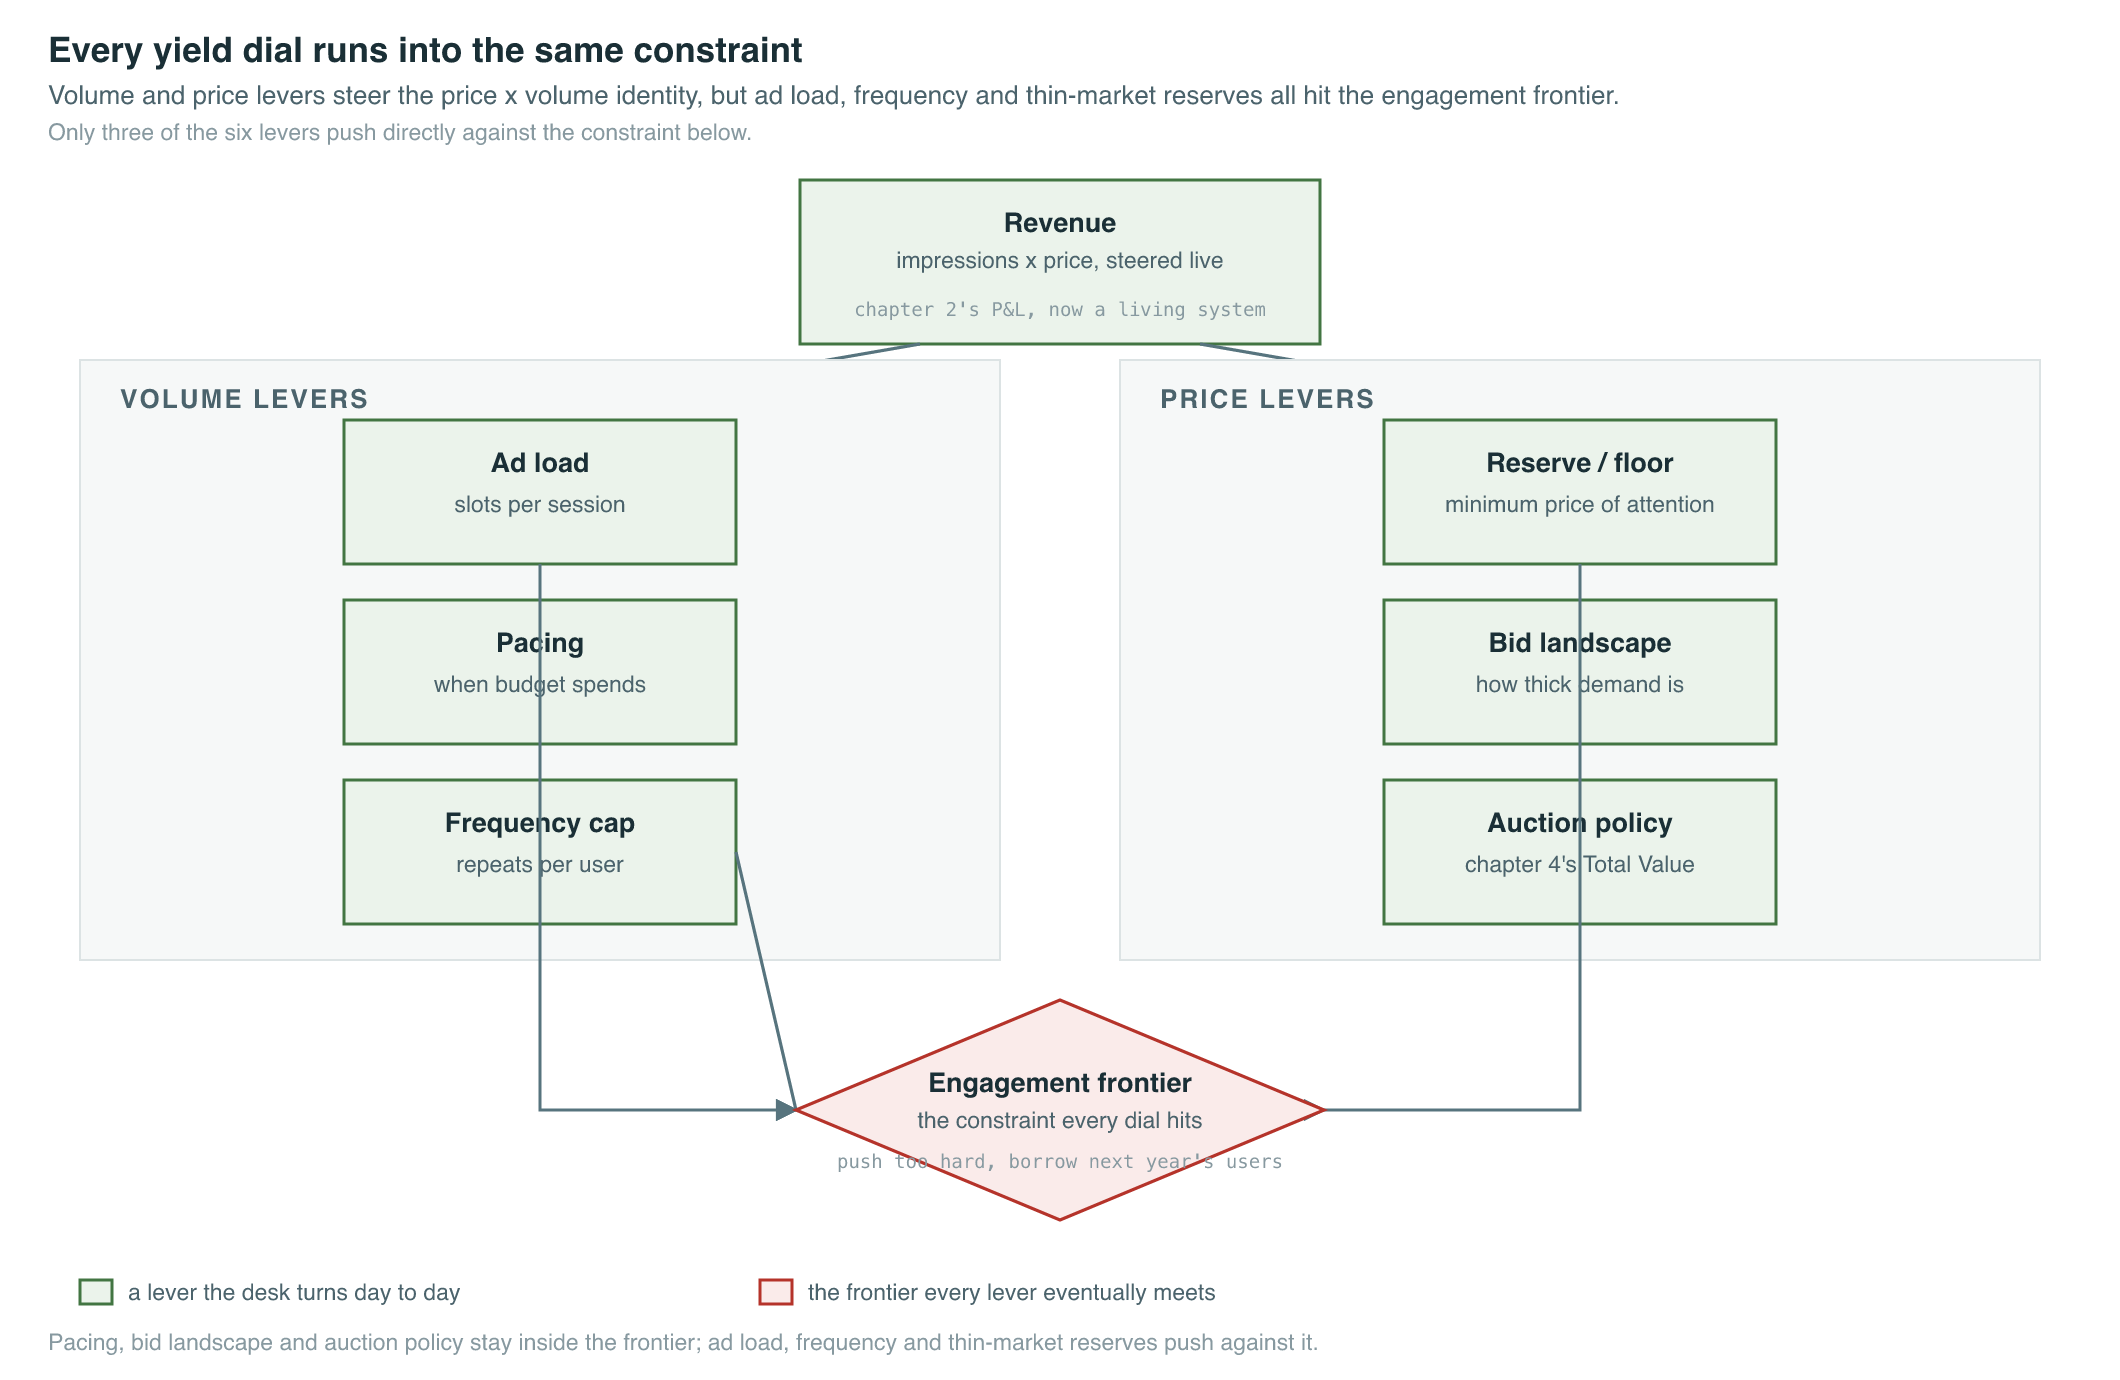
Figure 6.1 — The yield layer under the P&L. Every dial in this chapter is a steering input on the price × volume identity, and every one runs into the same constraint: the engagement frontier. The leader owns where each dial sits relative to that frontier; the desk owns the day-to-day setting within the band.
Ad load is the volume dial — and it has a curve, not a ceiling
Ad load — the share of a user’s session that is advertising, usually expressed as ads per N organic units or ad impressions per session — is the most direct volume lever you own. Add a slot and impressions rise mechanically. Book 1 taught the supply-side yield curve; here the curve is on engagement. The first incremental ad on a surface is nearly free: users barely notice, revenue rises, retention is unmoved. The tenth is not free. Somewhere along that curve the marginal ad starts costing you sessions — and because impressions next year are sessions this year compounded, you are borrowing volume from your own future.
The instructive live example is Reels. Meta grew Reels from a near-zero monetizing surface into one carrying a large share of impressions — Reels rose from roughly 19% of Instagram impressions in Q1 2025 to about 33% in Q1 2026 (industry analysis of Meta disclosures, 2026 — fast-moving, re-verify). That is ad-load expansion working as designed: new inventory absorbing demand and growing impressions without forcing more ads into the mature Feed. But the yield signature tells the rest of the story. Reels placements clear at materially lower CPMs than Feed — commonly cited at 20–40% below Feed (vendor-reported, 2026) — and the shift of impression mix toward Reels pulled reported Instagram CPMs down a few points year over year even as Meta’s blended price per ad rose 12% worldwide (Meta Q1 2026; industry analysis — directional).
That is the lesson a leader must hold: expanding load grows volume but moves your price mix, and the two do not net out the way a spreadsheet pretends. New, lower-priced inventory dilutes average price even as total revenue grows. The defensible call is not “load good” or “load bad” — it is which surface has room left on its engagement curve, and whether you are growing impressions into real incremental demand or just thinning your own price.
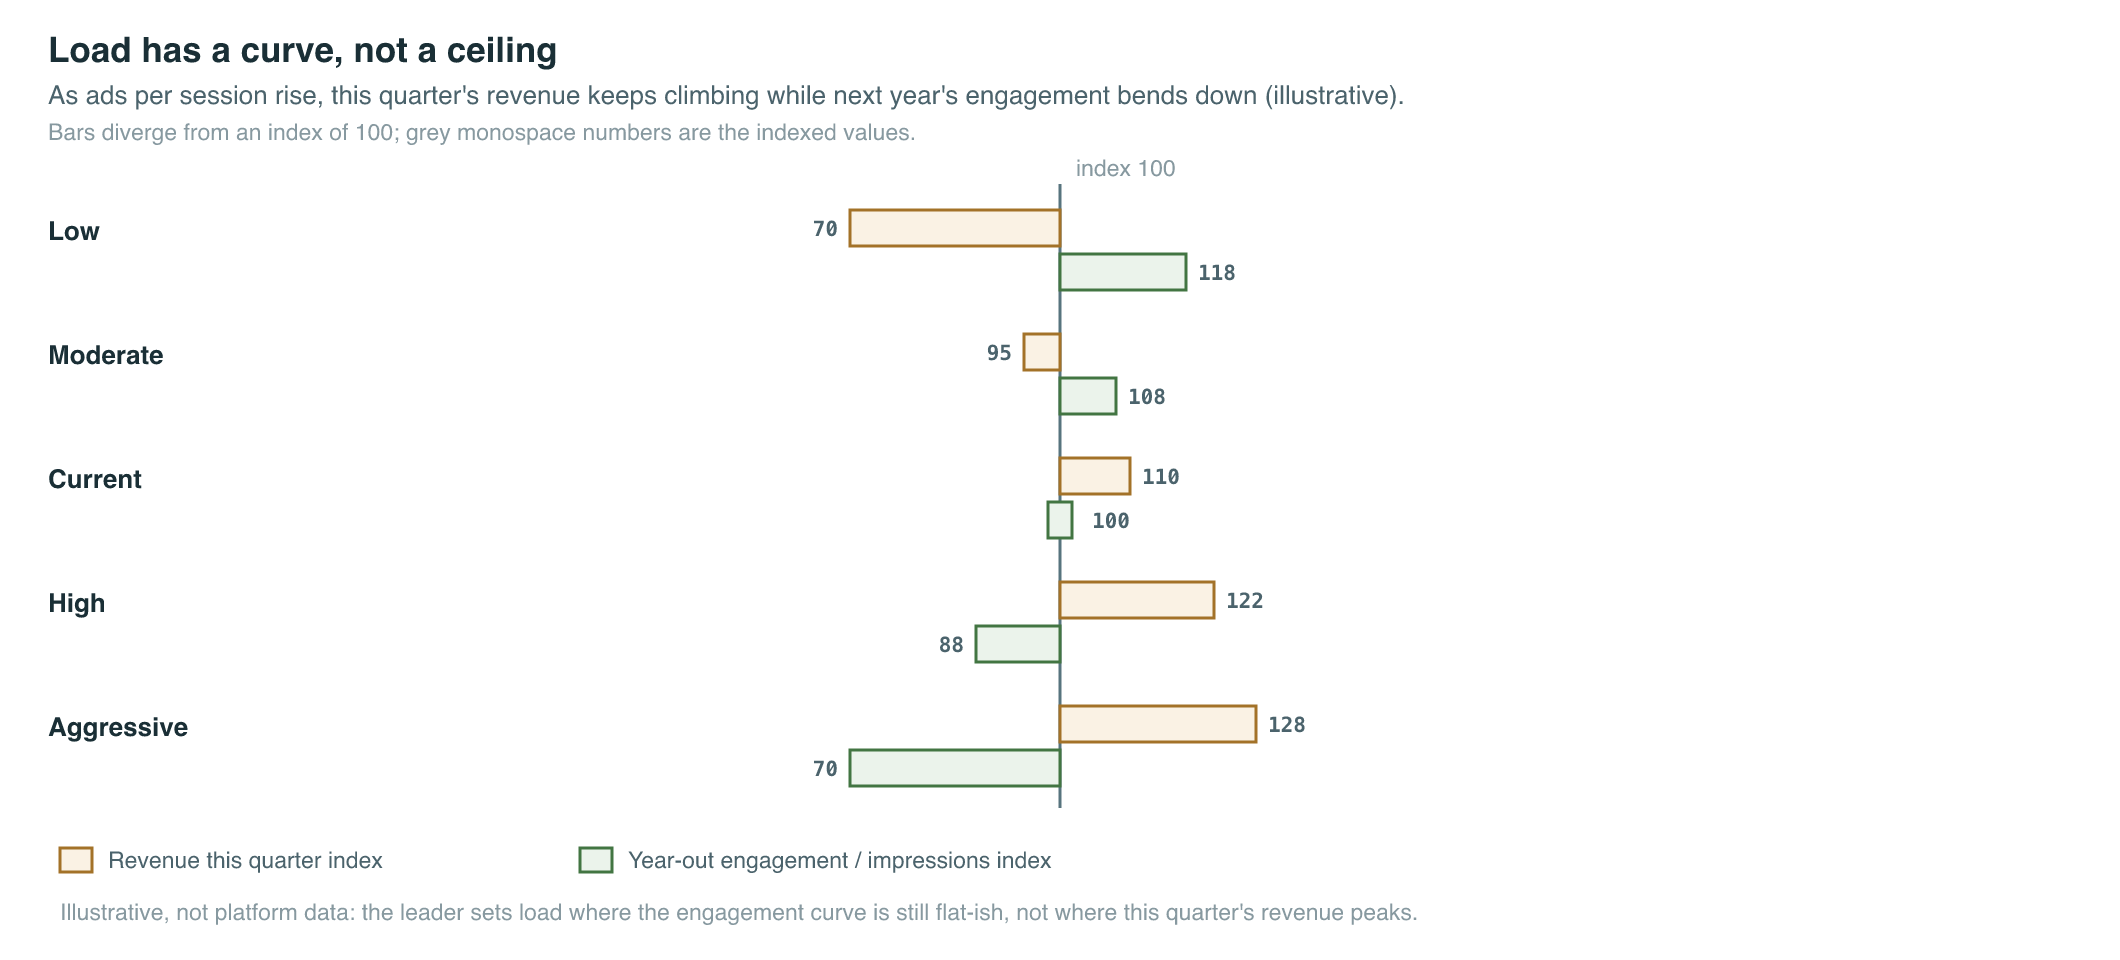
Figure 6.2 — Load has a curve, not a ceiling (illustrative). Near-term revenue keeps rising as you add load, but the year-out engagement curve bends down and then falls off. The leader sets load where the engagement curve is still flat-ish — not where this quarter’s revenue curve peaks.
Pacing: why budgets don’t spend all at 9am — and who gets the upside
Pacing is the control that spreads an advertiser’s budget across the day or campaign window rather than spending it in one early burst. Without it, every budget would race to exhaust itself the moment auctions open; thin late-day auctions would clear cheap, early auctions would overheat, and advertisers would miss the users who show up at 8pm. Pacing is therefore yield infrastructure: it keeps demand thick across the whole day so clearing prices stay stable and inventory stays full when the valuable users actually arrive.
For decades pacing was the advertiser’s burden — set a daily cap, watch it, adjust. The shift you must understand is that pacing is migrating into the platform’s autobidder, and with it, control. Demand-led pacing, announced by Google ahead of Marketing Live 2026, lets Google’s AI spend more on high-demand days and less on slow ones within a monthly budget and daily limit, rather than holding a flat daily target (Google, Marketing Live 2026 — fast-moving). The same release bundle reports a 66% reduction in manual budget adjustments from advertisers on total budgets, and — for the Smart Bidding Exploration feature shipped alongside it, not demand-led pacing itself — an average 27% more unique converting users (Google, 2026 — vendor-reported; the 27% is a Smart Bidding Exploration figure, not a pacing result).
Read that as a leader, not a buyer. When the platform owns pacing, two things move. First, yield: it can smooth demand across the day to defend clearing prices and lift fill — a genuine marketplace good. Second, control and trust: the advertiser has handed you the when of their spend, on top of the who and how much already ceded to the autobidder (ch4). An advertiser who discovers their budget front-loaded into a day that didn’t convert will not blame demand; they will blame your pacing. The yield win is real; the trust exposure is the bill, and you own both.
FIGURE 6.3 (spec): A two-panel line chart titled “Pacing: flat vs demand-led.” Left panel “Flat daily pacing” shows a near-horizontal spend line across seven days with a jagged conversion line that the spend ignores. Right panel “Demand-led pacing” shows a spend line that rises on the two high-conversion days and dips on the slow weekend, hugging the conversion curve, capped by a dashed “monthly budget / daily limit” ceiling. Caption: “Demand-led pacing lets the platform move spend toward demand — a yield gain the platform captures and an element of timing control the advertiser cedes.” Alt-text: “Two charts contrasting flat daily ad spend against demand-led spend that follows the conversion curve under a budget ceiling.”
Reserves and bid landscapes: defending price when demand is thin
Chapter 4 introduced the reserve price as auction policy — the floor below which you won’t sell. In the yield layer it becomes a daily operating instrument, and its real test is thin demand. When an auction has ten serious bidders, the second-price mechanism defends your price for you; the runner-up does the work. When an auction has one bidder — a common state in low-density Rest-of-World markets and on new surfaces — there is no runner-up, and price collapses to the floor. The reserve is the only thing standing between a thin auction and giving inventory away.
This is why Maya’s RoW reserve hike is a legitimate yield move, not friction. Raising the floor where auctions already clear near it does two things: it lifts realized eCPM on the impressions that still sell, and it signals to autobidders that this inventory has a real minimum value — which, over time, pulls bids up rather than down. The risk is the mirror image: set the reserve too high and you don’t lift price, you unsell the impression entirely. An unsold impression earns zero and, worse, a user saw a blank or a house ad. The leader’s question is the bid landscape — the distribution of bids competing for a given slice of inventory. Thick landscape: reserves are a light touch, the auction defends itself. Thin landscape: reserves are doing the heavy lifting, and the setting is a genuine revenue-versus-fill trade you must own.
The geography ties straight to Chapter 3’s profit-pool map. In a dense, high-ARPU market (US&Canada, where Meta’s full-year 2024 ARPU ran ~$233 versus ~$14 RoW — Meta FY2024 10-K; annual ARPU, not quarterly), the landscape is thick and reserves are hygiene. In the thin RoW markets, the reserve is the price — which is exactly why the call belongs to the leader who owns the geo strategy, not to a desk optimizing fill rate in isolation.
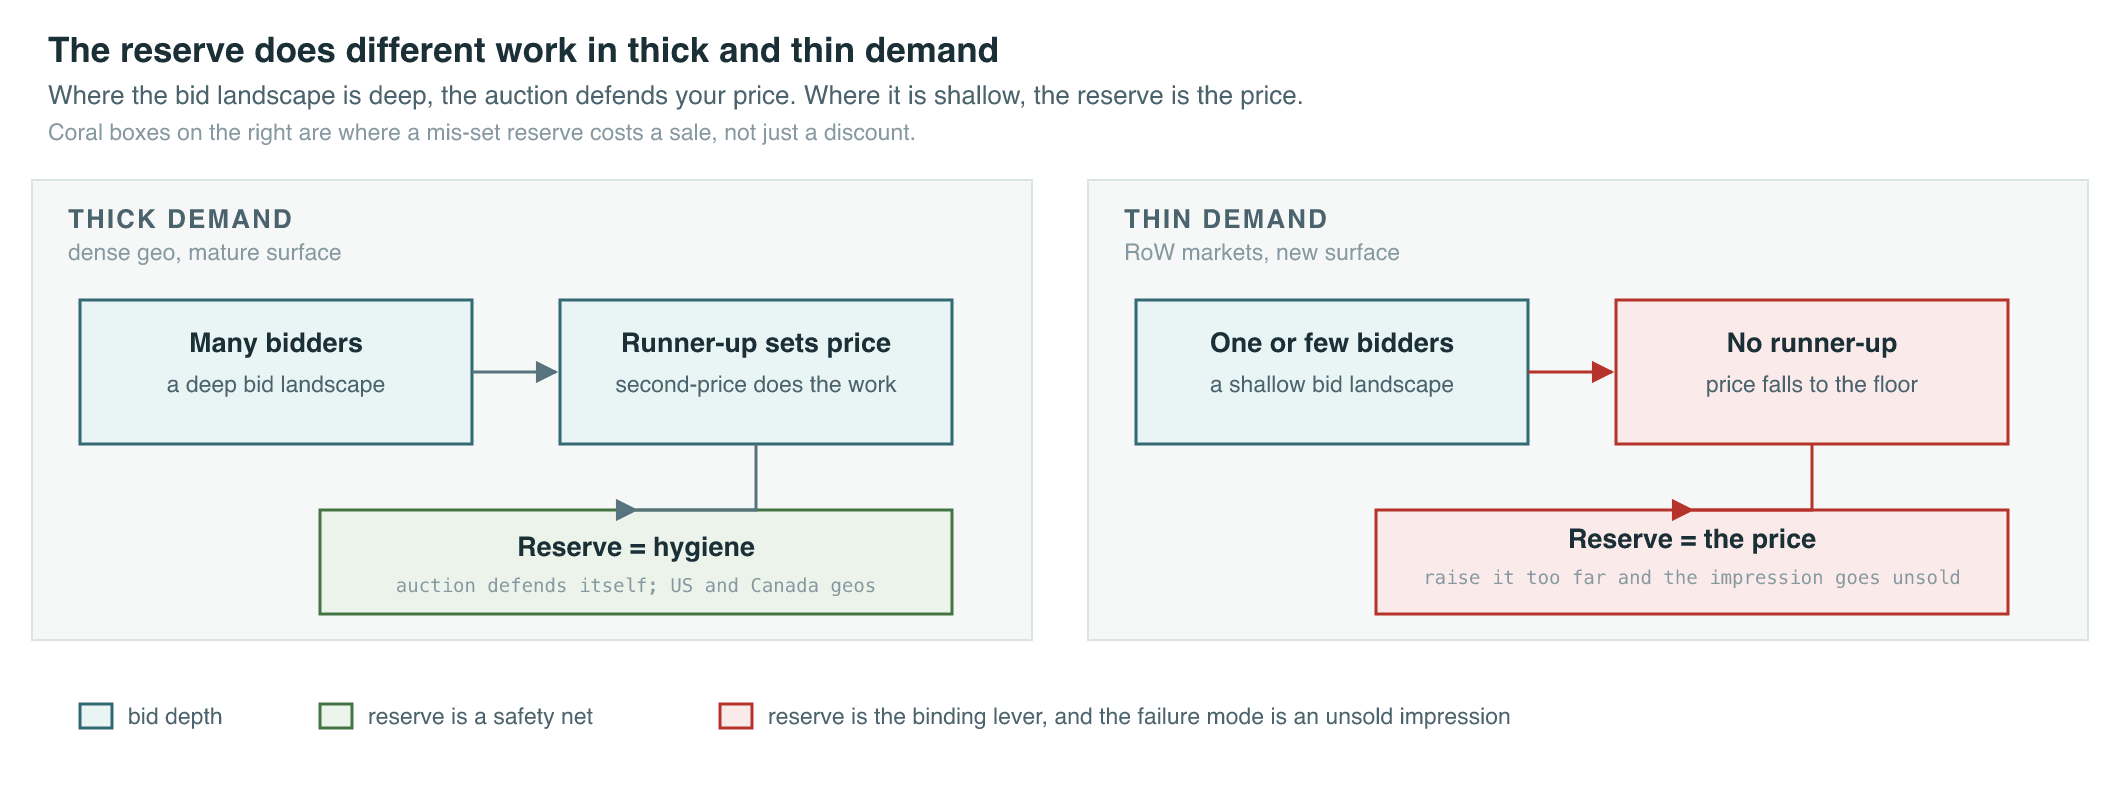
Figure 6.4 — The reserve does different work in thick vs thin demand. Where the bid landscape is deep, the auction protects your price and the reserve is a safety net; where it is shallow, the reserve is your price, and the revenue-versus-fill trade is a leader-owned call.
Frequency: the dial where volume turns negative
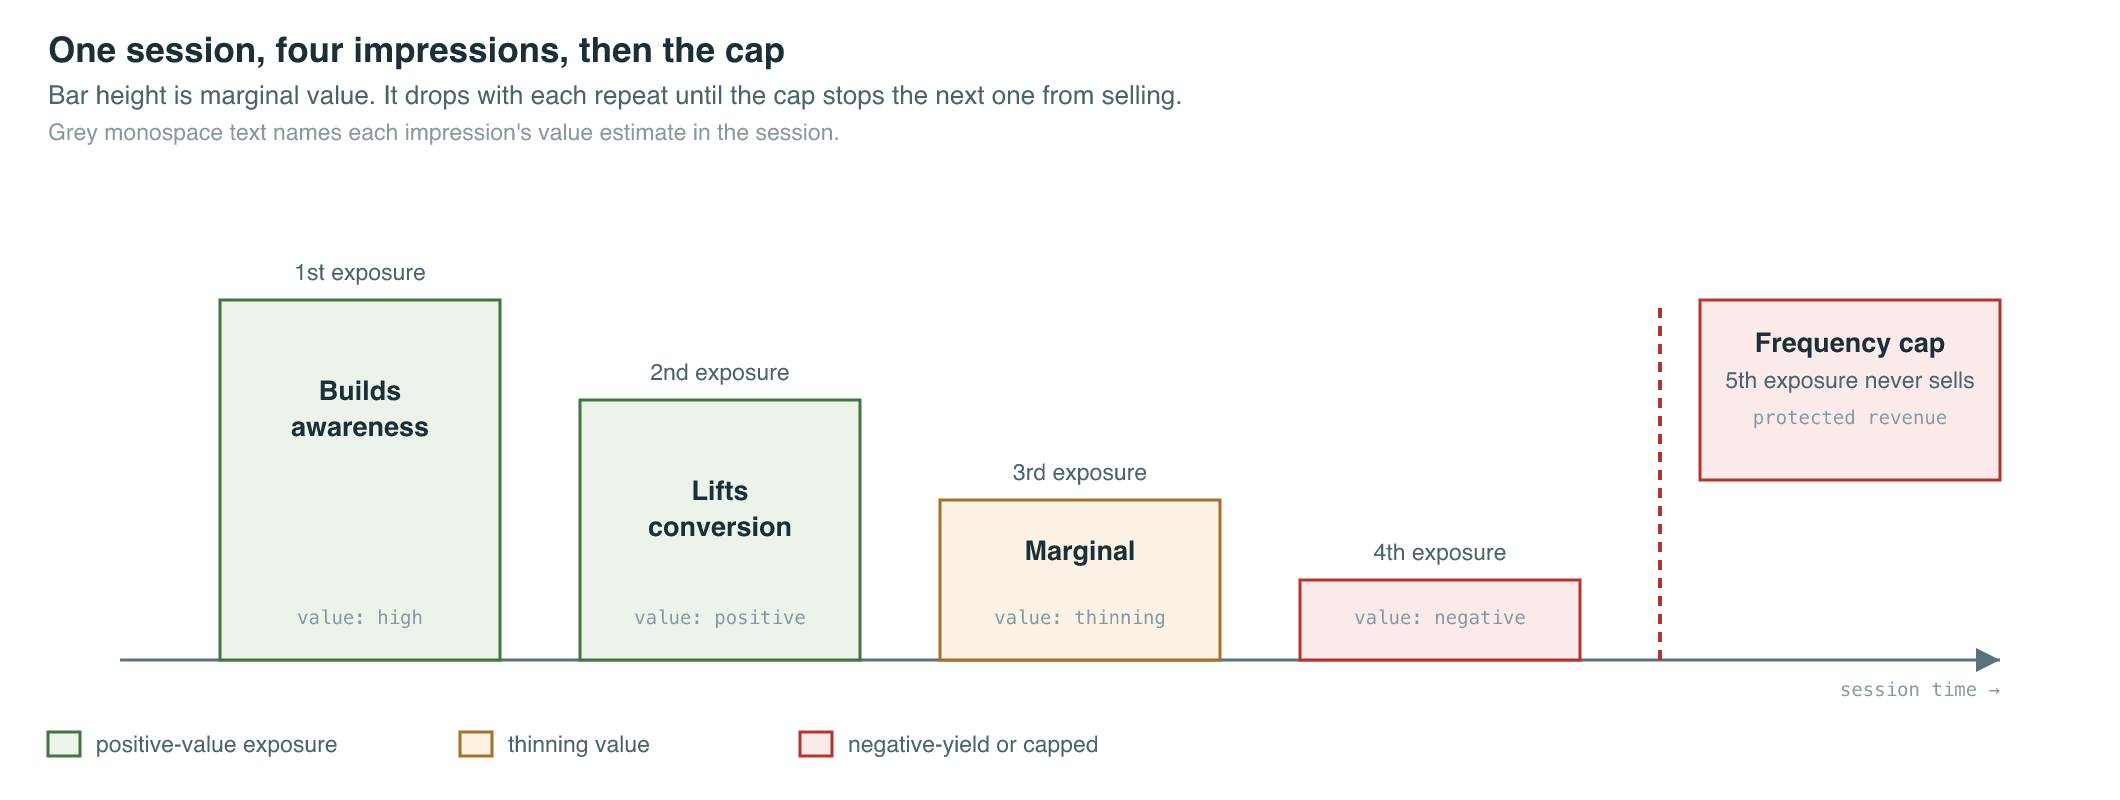
Most yield levers trade near-term revenue against long-run engagement. Frequency is the one where, past a point, both turn negative at once — which makes it the most underrated dial on the board. Frequency is how many times a given user sees the same ad or advertiser in a window. The first exposure builds awareness; the second and third can lift conversion; somewhere past that the same impression annoys the user, the advertiser’s cost per result rises, and your engagement erodes. You are selling an impression that destroys value on three sides simultaneously.
The operating numbers are well-documented at the campaign altitude: prospecting frequencies of roughly 1.5–2.0 tend to sit at optimal CPM, while frequencies above 3.0 trigger ad fatigue that can raise costs 20–50% (vendor-reported, 2026 — directional). At the leader’s altitude the specific numbers matter less than the shape: there exists a frequency past which one more impression is a negative-yield impression. Selling it books revenue this second and costs you more than that in advertiser performance and user goodwill over the quarter.
This is precisely Maya’s heavy-user cohort seeing four-plus exposures with rising complaints. The temptation — because the impressions are there and demand wants them — is to sell them. The leader’s call is the opposite: a frequency posture that caps the negative-yield tail, treating the cap not as lost revenue but as protected revenue. The cap costs visible impressions today; it protects advertiser cost-per-result and user sessions, both of which compound. Frequency capping is a yield decision disguised as a hygiene setting, and selling the negative-yield tail is the most seductive way to make a great quarter and a worse year.
Same-Lever Scorecard
How the majors steer the yield layer — ad load, pacing, reserves, and frequency posture. Figures dated and hedged inline.
| Platform | Ad-load posture (volume) | Pacing / yield engine | Reserve & frequency posture | Tell for the leader |
|---|---|---|---|---|
| Meta | Aggressive new-surface load: Reels ~19%→~33% of IG impressions Q1’25→Q1’26 (industry est., re-verify); impressions +19% Q1 2026 | Autobidder-managed; budget pacing folded into Advantage+ | Quality-weighted auction (ch4); frequency managed via Advantage+ placements | Growing volume into new surfaces, accepting CPM mix dilution (Reels 20–40% below Feed) for total revenue |
| Deliberately low load; scarce high-intent feed | Conservative pacing; protects a thin, premium inventory pool | High effective reserves via premium CPMs (~+30% in 2025, vendor est.) | Low load + high price; defends scarcity rather than chasing volume | |
| TikTok | High load on an infinite-scroll surface; Smart+ governs delivery | Pacing absorbed into Smart+ automation (~9%→~42% of US perf campaigns in a year) | Reserves/frequency receding into the autobidder; opacity risk | Volume-rich surface; the yield dials are moving inside the black box |
| Google / YouTube | Search load capacity-bound by query volume; YouTube load expanding | Demand-led pacing (Marketing Live 2026): AI moves spend to demand within budget | Ad Rank thresholds act as dynamic reserves; journey-aware bidding | Pacing explicitly migrating from advertiser to platform — yield gain, control shift |
| Amazon | Load gated by genuine purchase intent on retail surfaces | Pacing tied to query/shopping sessions; closed-loop signal | Reserves backed by accurate purchase-propensity estimates | Intent density keeps the bid landscape thick — reserves rarely the binding lever |
| Pinterest (wildcard) | Moderate load; planning-intent feed | Performance+ automated pacing | Reserves modest; frequency matters on a return-to-plan surface | Lower-funnel intent lets modest load clear without heavy reserves |
Decision or Diagnostic?
Sort the yield layer’s metrics by who owns them. The leader sets where the dials sit relative to the engagement frontier; the launch desk tunes the operational settings inside the band.
| Decision (board / leader owns) | Diagnostic (IC / launch-desk owns) |
|---|---|
| Ad-load level & expansion rate per surface relative to engagement | Pacing curve / spend smoothness — the intra-day delivery shape, monitored at the desk |
| Reserve-price policy by surface and geo (esp. thin-demand markets) | Per-auction clearing price / realized eCPM — operational, watched continuously |
| Frequency posture — where to cap the negative-yield tail | Fill rate / unsold-impression rate — a desk health metric |
| Volume-vs-price-mix trade — growing impressions vs protecting average price | Bid-landscape depth for a given inventory slice — an input, not a board number |
| Pacing-control posture — how much spend-timing to absorb into the autobidder | Frequency distribution / fatigue curves per campaign — campaign-level diagnostics |
The leader’s call. The trade-off you own across the whole yield layer is how hard to steer volume and price this quarter against the engagement and trust that produce next year’s volume and price. The three settings are one decision: how much load each surface can take before the engagement curve bends, where the reserve floor sits when the bid landscape is too thin for the auction to defend itself, and where to cap the frequency tail that turns volume negative. Meta resolved the load question by expanding onto new inventory — taking Reels from near-zero to roughly a third of Instagram impressions — and accepting that the new surface clears 20–40% below Feed, because growing impressions into real incremental attention beats forcing more ads into a mature feed and burning engagement. Google resolved the pacing question by pulling spend timing into the platform with demand-led pacing — a genuine yield gain, paid for in advertiser control the platform must not abuse. Four quarters out: push load past the engagement bend, sell the negative-yield frequency tail, and over-reserve thin markets into unsold inventory, and you book a strong quarter, then watch sessions soften, advertiser cost-per-result climb, and fill rate sag — the diffuse, lagged bill that no single dashboard pins back to the dials you turned. Steer them with restraint and you trade a measurable point of near-term volume for a surface that keeps producing impressions and advertisers whose results keep them spending. X is the standing proof that when trust breaks, no pacing curve or reserve schedule brings the budgets back. Run the yield layer like a central banker smoothing a cycle, not a trader maximizing the close.
Key terms
| Term | One-line definition |
|---|---|
| Ad load | The share of a user’s session that is advertising (ads per N organic units, or ad impressions per session); the most direct volume lever. |
| Yield layer | The operational machinery — load, pacing, reserves, frequency — that steers price and volume across a quarter on top of the auction policy. |
| Pacing | The control that spreads an advertiser’s budget across the day/campaign window so demand stays thick and clearing prices stay stable. |
| Demand-led pacing | Platform-managed pacing that moves spend toward high-demand days within a budget cap, shifting spend-timing control from advertiser to platform. |
| Reserve price | The floor below which an impression won’t be sold; in thin-demand auctions, effectively the price rather than a safety net. |
| Bid landscape | The distribution of bids competing for a slice of inventory; thick landscapes defend price themselves, thin ones make the reserve the binding lever. |
| Frequency (cap) | How often a user sees the same ad/advertiser in a window; the cap that prevents selling negative-yield impressions past the fatigue point. |
| Negative-yield impression | An impression that books revenue now but destroys more value (advertiser performance + user engagement) than it creates. |
| CPM mix dilution | The fall in average price as lower-priced new inventory (e.g., Reels) grows its share, even while total revenue rises. |
Recap & what is next
- The yield layer is the operational sibling of the auction policy: load, pacing, reserves, and frequency are the dials that turn a static price × volume P&L into a living one, steered impression by impression across a quarter.
- Ad load has a curve, not a ceiling — the marginal ad grows volume but eventually borrows from next year’s engagement; expanding onto new surfaces (Reels) grows impressions while diluting average price, and the leader must read both effects, not net them.
- Pacing is migrating into the platform (Google’s demand-led pacing): a real yield gain that smooths demand and defends clearing prices, paid for in advertiser spend-timing control the platform must not abuse.
- Reserves do different work in thick vs thin demand — hygiene where the bid landscape defends price, the price where it doesn’t; the thin-market reserve call ties straight to the geo profit-pool map.
- Frequency is the dial where volume turns negative — past the fatigue point one more impression hurts advertiser results and user sessions at once; capping the tail is protected revenue disguised as a hygiene setting.
- Sort the layer ruthlessly: load level, reserve policy, frequency posture, volume-vs-price-mix, pacing-control posture are yours; pacing curves, clearing prices, fill, bid-landscape depth, fatigue curves belong to the launch desk.
Maya can now steer price and volume without breaking the engagement that feeds them — but every dial in this chapter assumes the impressions she sells are worth selling. A high-load, well-paced surface still rots if the ads on it are clickbait that the user-value term should have demoted. Chapter 7 — Quality, Integrity & the User-Value Term takes you there: how ad-quality scoring and penalties keep revenue and experience aligned, why integrity is a yield decision and not a policing one, and how to set incentives so that the two never diverge.