The promise. In Chapter 1 you decided how aggressively to monetize the closure you own versus how visibly to share control — and you saw that the consequence lands, four quarters out, on ARPU and advertiser trust together. This chapter hands you the instrument panel for that fight. Your job, stripped of its org chart, is to steer one identity: revenue equals the impressions you serve times the price each one clears. Two ways to grow it, two very different bills. By the end you will be able to walk into your first budget review and answer the question your CFO will actually ask — do we grow next year on volume or on price? — and defend the answer against the engagement it costs.
You will be able to:
- Decide where to set ad load on each surface relative to the engagement it carries, and how aggressively to expand it this year.
- Decide whether next year’s growth is bought primarily on volume (more impressions) or price (higher yield), and name the retention risk each carries.
- Reason about ARPU versus ARPP — why they share a numerator and differ in denominator, and why a leader who swaps one for the other in a board deck is wrong.
- Defend which P&L numbers belong in front of the board as decisions, and which stay at the launch desk as diagnostics.
Builds on: Book 1 ch1 (RPM = eCPM × fill, the money flow) and ch5 (the yield curve, sell-through); Book 2 ch1 (the closed loop and the flywheel). Sets up ch3 (where that revenue actually lives — by geography and surface) and Part II (the engine that sets price).
The one identity you actually own
Maya’s first week at a top-five walled garden ends with a planning template in her inbox. Forty tabs, every product surface, a column for every region. It looks like a job for an accountant. It is not. Underneath the forty tabs is a single equation, and her entire mandate is to bend it:
revenue = impressions × price
That is the whole P&L of a monetization leader, written small. Impressions is the volume of ad slots you fill and serve. Price is what each one clears for in your auction — at platform scale, the average price per ad. Everything else on the planning template is a way of moving one of those two terms.
You don’t have to take this on faith. Meta publishes its ad business in exactly this form. For full-year 2025, impressions delivered grew 12% year over year while the average price per ad rose 9%, and the two compounded into 22% ad-revenue growth — $196.18 billion (Meta Q4/FY2025 earnings, Jan 2026). That is not a coincidence of disclosure. It is the company telling its board, every quarter, here is how much of our growth we bought with volume and how much with price. The identity is the board language.
The fuller form unpacks the volume term so you can see which team owns which knob:
revenue = users × time-per-user × ad load × price
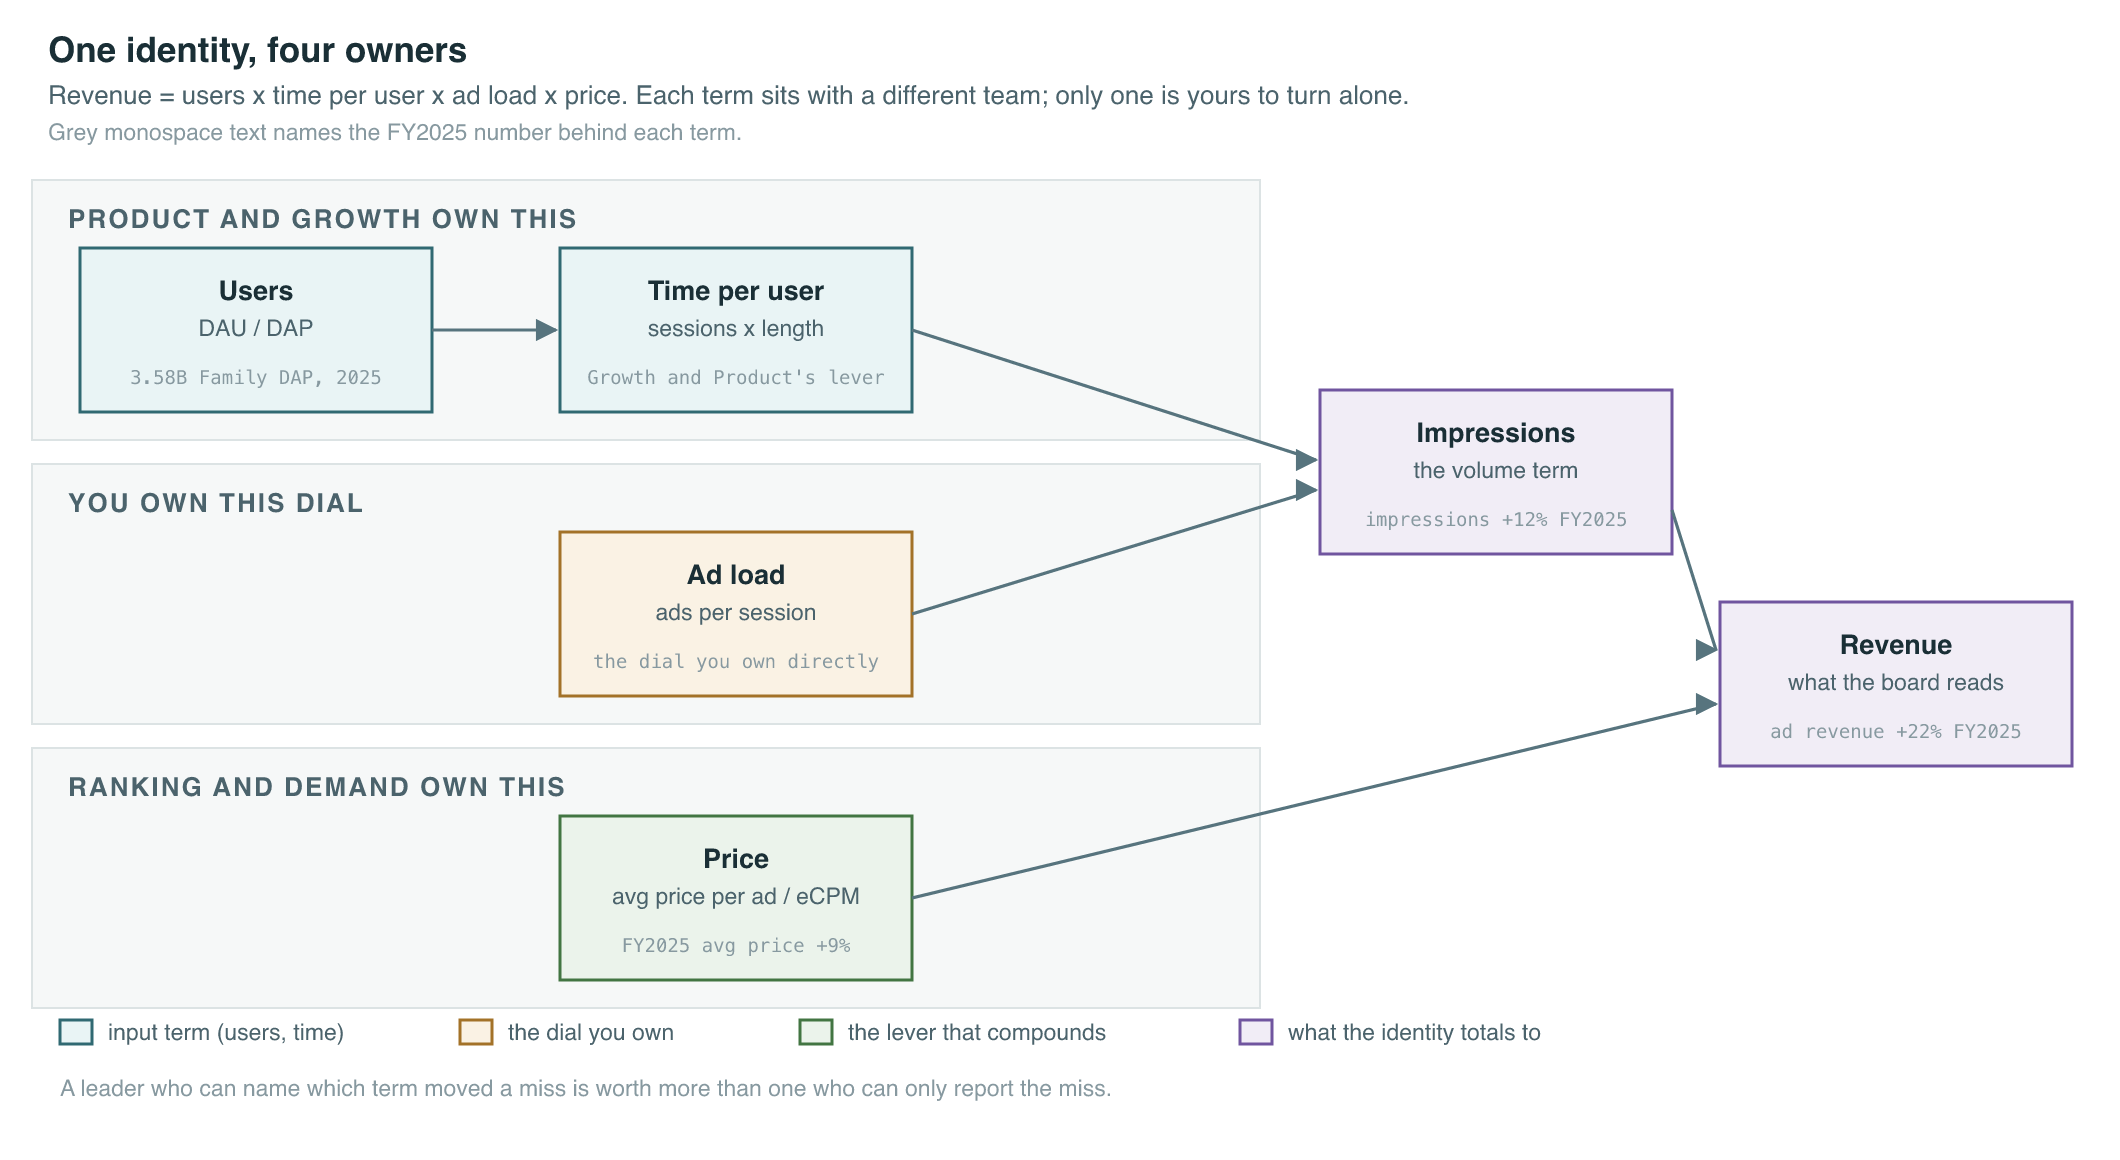
Figure 2.1 — The revenue identity, annotated by who owns each lever. Users and time-per-user are mostly Growth and Product’s to move; price is mostly your ranking and demand teams’; ad load is the dial that sits squarely on your desk, and it is the dangerous one.
Notice what this buys you politically. When growth slows, the reflexive question in the room is “whose fault.” The identity reframes it: revenue softened because users plateaued, or time fell, or you under-loaded, or price compressed. Four different problems, four different owners, four different fixes. A leader who can decompose the miss in real time is worth more than one who can only report it.
Two ways to grow — and two different bills
Every plan to grow that identity is, at bottom, a bet on one of two branches.
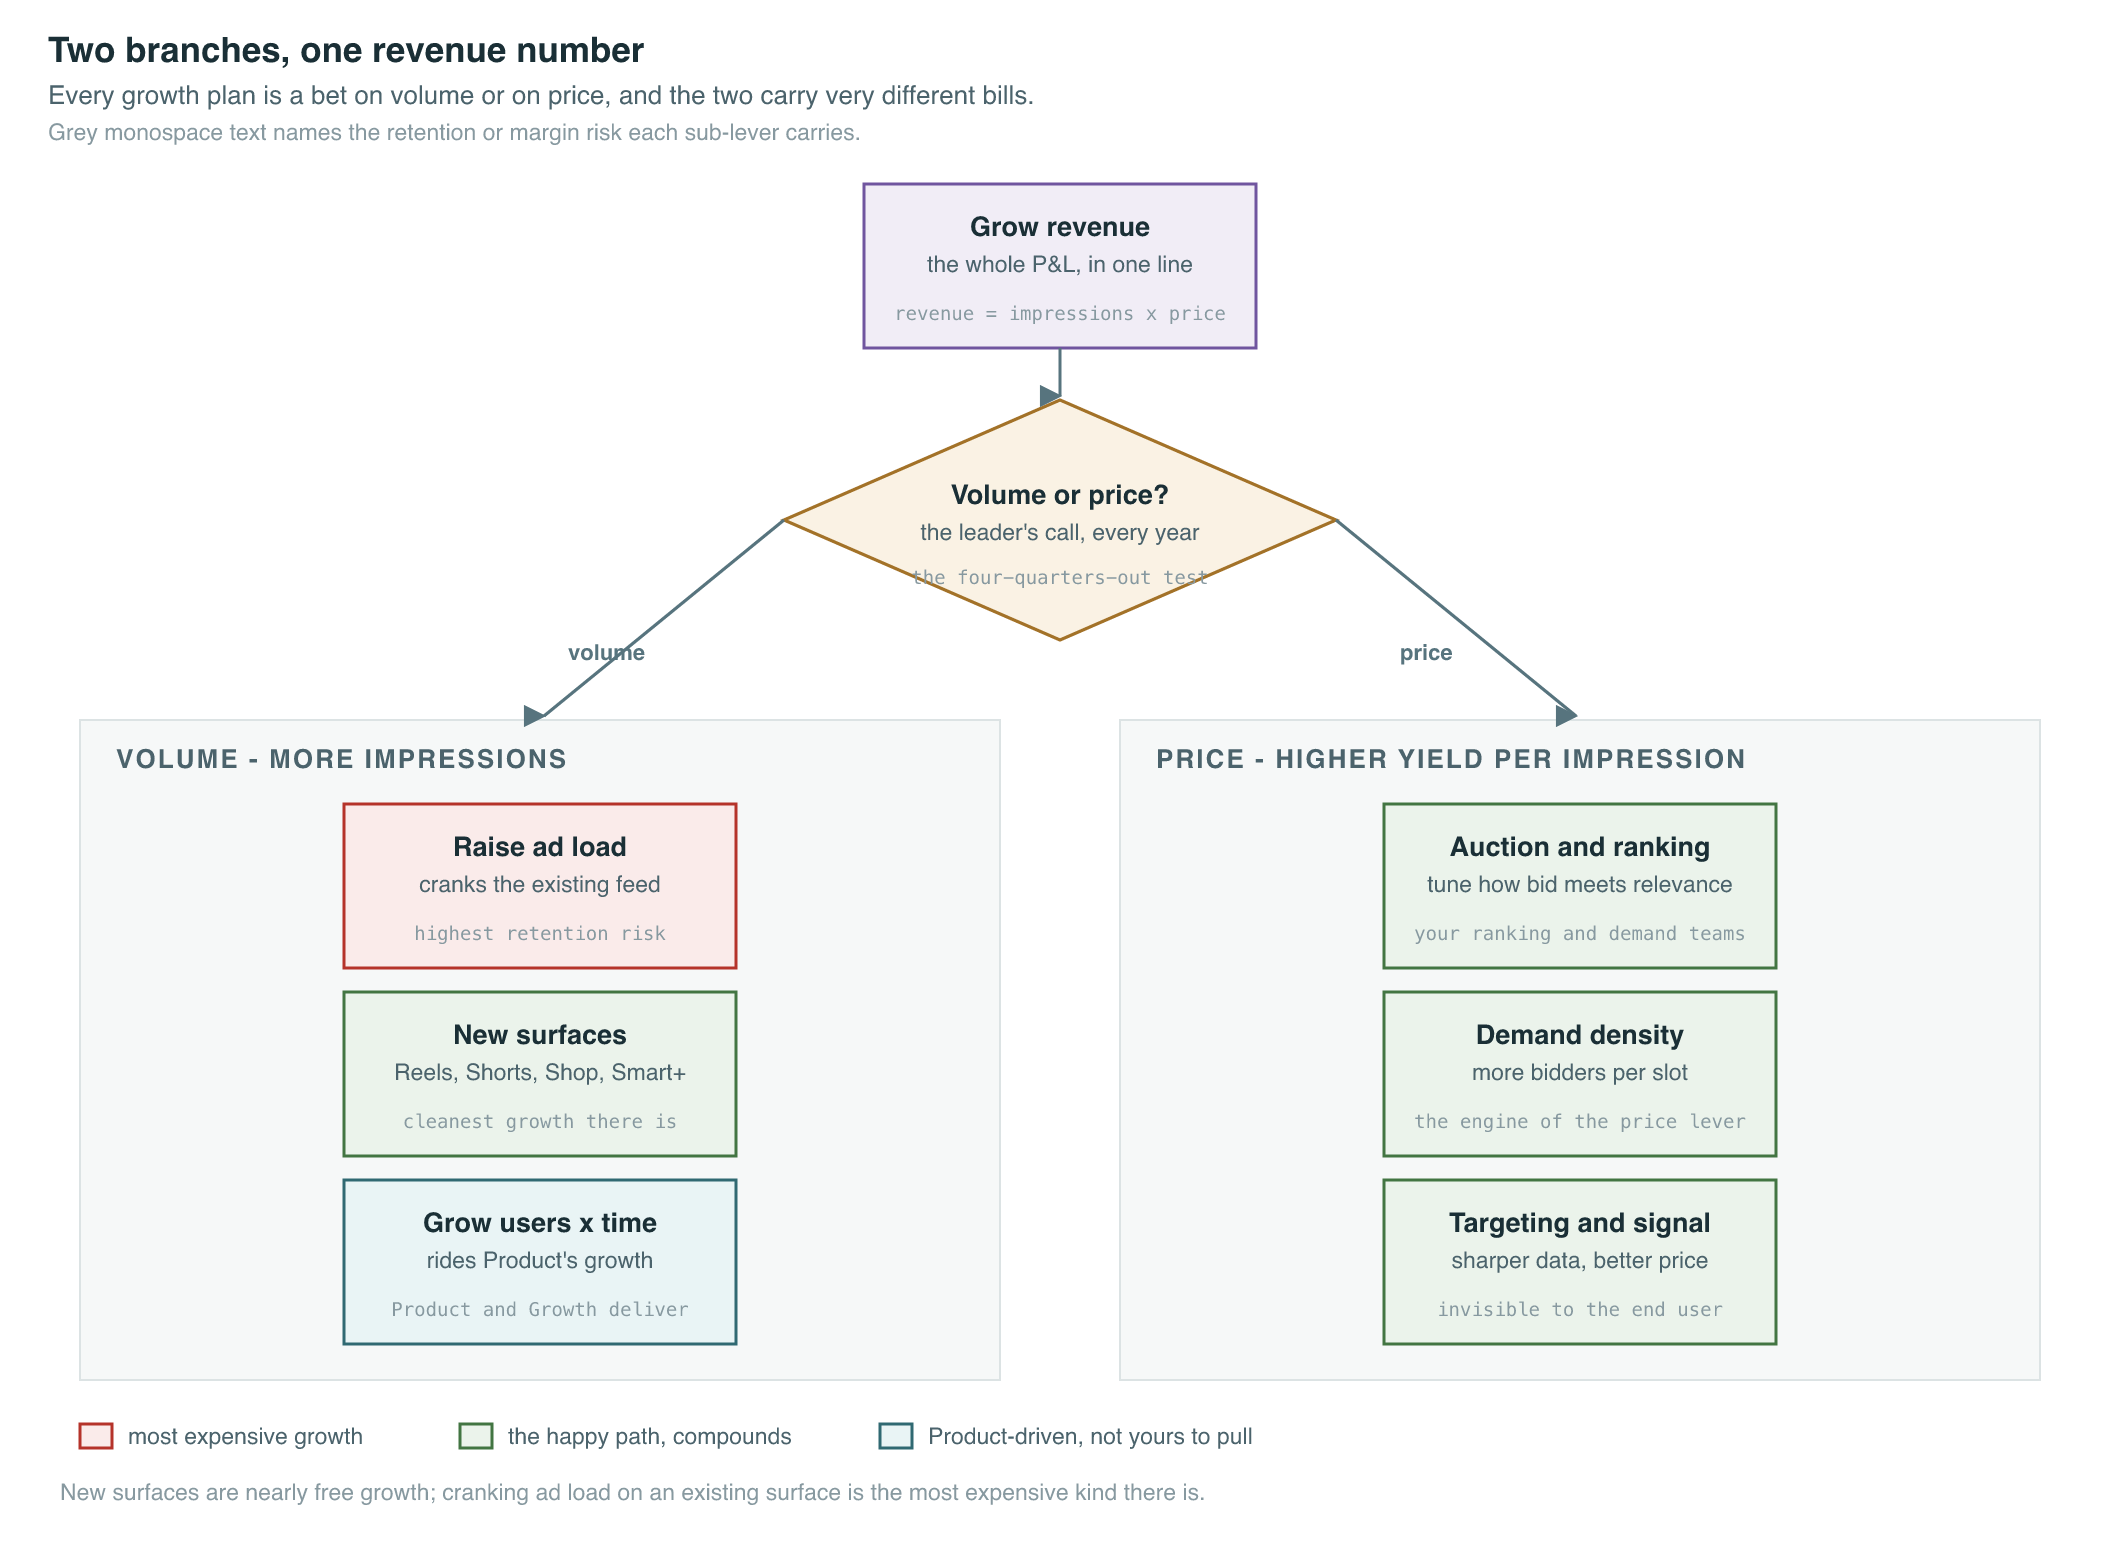
Figure 2.2 — The two growth levers and their sub-levers. The volume branch adds slots; the price branch makes each slot worth more.
The volume lever adds impressions — by raising ad load, by lighting up new ad-supported surfaces, or by riding user and time growth that Product delivers. The price lever makes each impression clear for more — by tuning the auction and ranking, by deepening demand density (more advertisers competing for each slot, which Book 1 ch5 traced up the yield curve), or by improving the signal that lets the auction price an impression accurately.
They are not equally priced, and the difference is the most important thing in this chapter. Here is the comparison you should be able to draw on a whiteboard from memory:
| Volume-led growth | Price-led growth | |
|---|---|---|
| Levers | Ad load, new surfaces, user/time growth | Auction tuning, demand density, signal/targeting |
| Ceiling | Hard — finite slots, finite attention, ad-load saturation | Soft — bounded by advertiser ROI, can compound for years |
| Retention risk | High when via ad load; low when via genuinely new surfaces | Low — invisible to users; risk sits with advertisers (ROI) |
| Where the risk lands | On users (engagement, churn) | On advertisers (do they keep paying the clearing price?) |
| When to choose | Under-monetized surface; new inventory you can introduce cleanly | Mature surface near its ad-load ceiling; rich demand to mine |
The asymmetry: volume via new surfaces is the cleanest growth there is, volume via ad load is the most expensive, and price is the one that compounds. A genuinely new ad-supported surface adds impressions without taking anything from the user — they didn’t have those ad slots before. Price growth is nearly invisible to users; the bill, if there is one, lands on advertisers when the clearing price outruns the return they get. Ad load is the trap, and it gets its own section because it is the lever you most directly control and the one most likely to flatter this quarter while mortgaging next year.
You can watch the same revenue number get bought two different ways within a single company. Meta’s full year 2025 was a fairly balanced 12% volume / 9% price split. But zoom into Q4 2025 alone and the mix flips heavily toward volume: impressions up 18% year over year, average price per ad up only 6%, for 24% ad-revenue growth ($58.14 billion ad revenue; $59.89 billion total) (Meta Q4/FY2025 earnings, Jan 2026). Roughly the same growth rate, a very different recipe. That is the point to make to your board: the mix is a decision, not a fact handed down by the market.
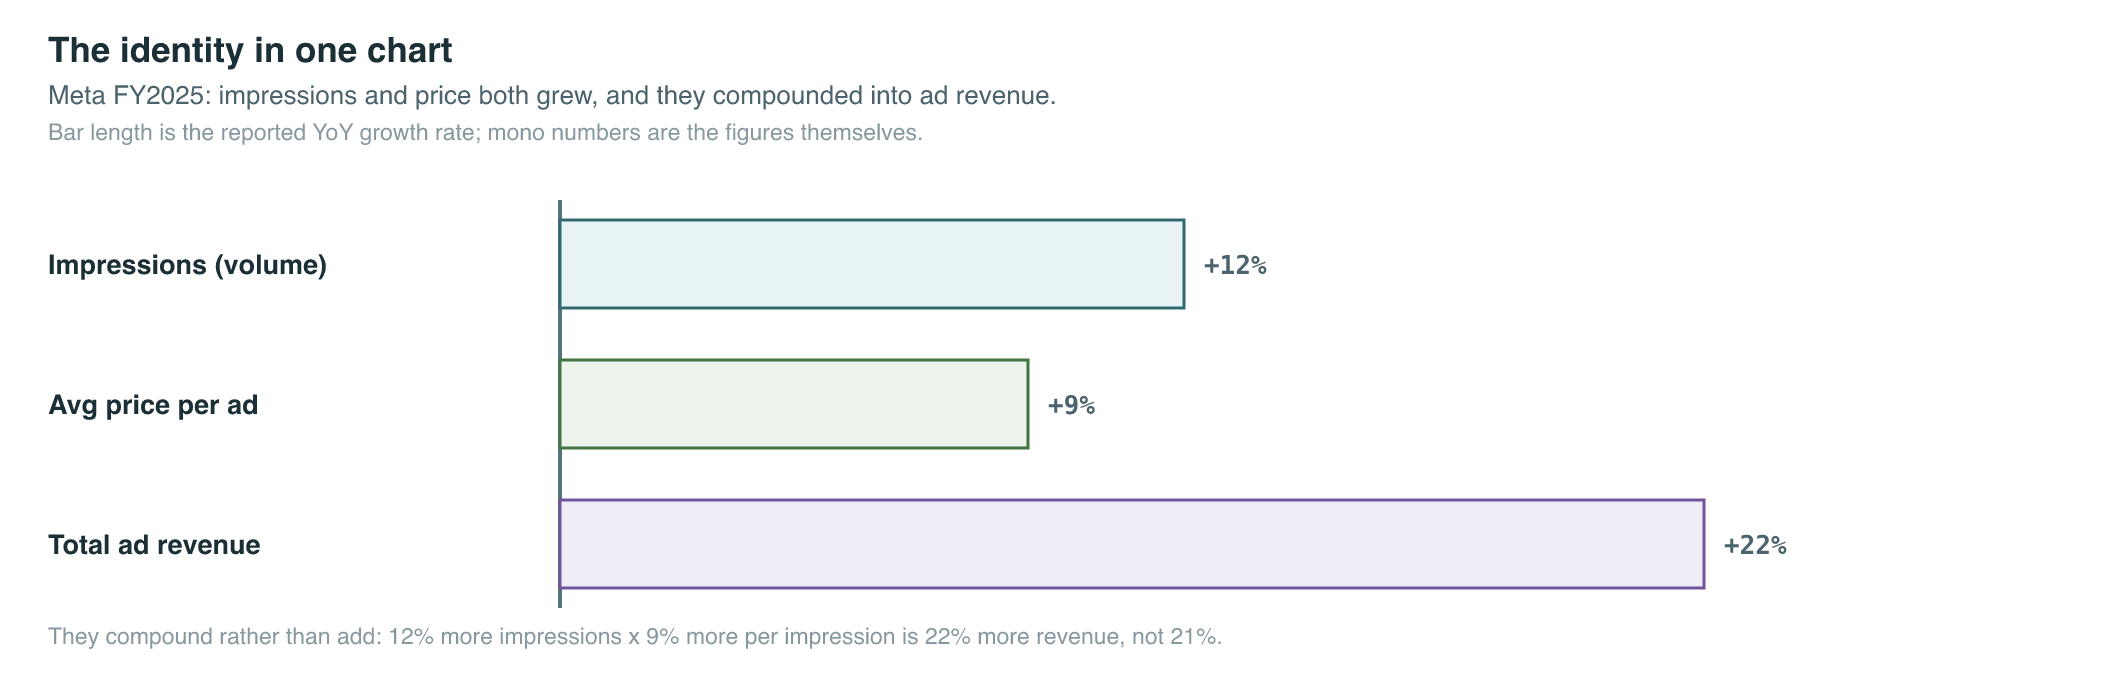
Figure 2.3 — The identity in one chart. Volume (+12%) and price (+9%) compound into +22% ad-revenue growth for the full year. The board reads three bars; your launch desk reads the hundred decisions under each.
Ad load: the lever that borrows from next year
If you internalize one thing from this chapter, make it this: ad load buys revenue this quarter by spending engagement next year, and the exchange rate is terrible at the margin.
The reason is the shape of the curve. Large-scale studies of feed advertising find that user engagement grows roughly logarithmically with the number of impressions served — the first ad in a session carries the highest engagement probability, and each additional one returns less while costing more in user satisfaction. Research on feed ad load finds that moving from zero to two ads in a feed lifts short-term revenue and simultaneously raises feed and session abandonment (arXiv 2309.11518, Ad-load Balancing, 2023; arXiv 1811.10921, Facebook ad-exposure study). The revenue from the extra slot is immediate and shows up in this quarter’s number. The lost session, the slightly shortened visit, the user who opens the app one fewer time next month — those show up later, in users and time-per-user, the very terms that sit upstream of every future impression.
FIGURE 2.4 (spec): A two-curve chart. X-axis: ad load (ads per session, 0 to high). Y-axis (left): revenue per session, a curve that rises steeply then flattens and slightly bends down at the far right. Y-axis (right): user engagement / retention, a curve that is flat then bends steeply downward past an inflection point. A vertical dashed line marks the inflection — the “you are now borrowing from next year” line — sitting to the LEFT of the revenue peak. Annotation at the inflection: “Past here, every incremental impression costs more future engagement than it earns present revenue.” Caption: The ad-load curve. Short-run revenue keeps rising well past the point where long-run engagement starts falling — which is exactly why the lever is dangerous. Alt-text: Chart showing revenue per session rising and flattening while engagement falls past an inflection point that precedes the revenue peak.
This is why ad load fails the four-quarters-out test more often than any other lever. The test is simple and you should apply it to every monetization move: four quarters from now, does this raise ARPU and advertiser trust together, or does it raise one by spending the other? An ad-load increase almost always raises revenue in Q1 and quietly erodes the engagement base by Q4 — which means lower users × time, which means fewer impressions to sell, which means the price lever has less inventory to work against. You can win the quarter and lose the year.
The disciplined move is to treat ad load as a managed dial set per surface against that surface’s engagement headroom, not a growth lever you lean on when the number is short. The surfaces with the most ad-load headroom are usually the newest and most engaging ones — which is why the smart version of “grow on volume” is almost always “grow on new surfaces,” not “grow on cranking the existing feed.”
Monetizable engagement, not raw users or time
Here is the error that the users × time × ad load × price form invites: treating all engagement as equal feedstock for impressions. It is not. The only engagement that matters to your P&L is the engagement advertisers will pay against — call it monetizable engagement, the slice of attention attached to commercial intent or to an audience advertisers value.
TikTok makes the point brutally. The United States is roughly 10% of TikTok’s global users but generates roughly 41% of its worldwide ad revenue, with a US user worth about 4x the global average to advertisers (eMarketer, 2025 forecasts; US ad revenue ~$14.0B 2025 forecast). A leader who plans on raw user or time counts would have radically misvalued where the revenue actually comes from. The same user-minute is not the same dollar.
LinkedIn shows the inverse extreme: tiny audience by social-media standards, enormous value per impression because the engagement is professional intent. Microsoft reported LinkedIn crossing $5 billion in quarterly revenue for the first time in the quarter ended December 2025 (+11% YoY), with Marketing Solutions ad revenue estimated around $8.2 billion for 2025, up roughly 18% (Microsoft FY26 Q2 earnings, Jan 2026; eMarketer/Storyboard18, 2025). LinkedIn does not win on users × time. It wins because the engagement it sells is dense with intent advertisers will pay a premium to reach.
The leadership translation: when you evaluate a surface or a geo, do not price the attention — price the monetizable attention. A surface that adds enormous time but no commercial intent (think a pure entertainment feed with no purchase or B2B signal) grows the volume term on paper and barely moves revenue. A surface that adds modest time dense with intent can move price hard. This is the bridge to Chapter 3: the revenue lives where the monetizable engagement is, and that is rarely where the users are.
ARPU and ARPP: same numerator, different denominator — do not swap them
You will quote per-user revenue constantly, and you must get the denominator right, because a board that catches you using one as the other will rightly distrust the rest of the deck.
- ARPU (average revenue per user) divides revenue by an active-user base — and which base matters. Snap reports ARPU on quarterly daily active users (DAU). Reddit and Pinterest report on their own bases.
- ARPP (average revenue per person) is Meta’s metric, dividing by monthly active people across the family of apps.
Different denominators, non-comparable numbers. The deeper trap is that ARPU is not a single number at all — it is a geography. Meta’s 2024 ARPU was roughly $233/year in US & Canada versus ~$68 in Europe, ~$21 in Asia-Pacific, and ~$14 in Rest of World — worldwide blended ~$57 (Meta IR / aggregated, 2024 actuals). US & Canada is about 16x Rest of World, even though APAC plus RoW are roughly 70% of users. The peers rhyme: Snap’s 2025 North America ARPU ran ~$36.82 against Europe ~$11.37 (global quarterly ARPU ~$3.16 in Q3 2025, +2% YoY) (Snap Q3 2025; Statista). Pinterest’s 2025 US & Canada ARPU was ~$30.84 against a global blended ~$7.21 (Pinterest 2025 results; Statista/Investing.com). Reddit’s Q4 2025 ARPU reached ~$5.98 (+42% YoY), split US ~$10.79 versus International ~$2.31 (Reddit Q4 2025 earnings coverage, Jan 2026).
The leadership consequence is sharp: “grow on price vs volume” is, underneath, a geo-mix choice. If most of your remaining user growth is in low-ARPU geographies, that growth is a volume story with a low price ceiling — you are adding users worth a fraction of your incumbent base. Conversely, lifting price in a high-ARPU geography compounds far harder per user. When your CFO asks where next year’s growth comes from, the honest answer is usually a sentence about geography, not about levers in the abstract.
A note on scale metrics. Meta does not headline ARPU at all — it leads with daily active people: 3.58 billion Family DAP at end of 2025, +7% YoY (Meta Q4/FY2025 earnings, Jan 2026). Set that 7% user growth against the 22% full-year ad-revenue growth and the story writes itself: monetization-per-person — a price/yield gain — carried most of last year, not user volume. That single comparison is one of the most useful board slides you can build, because it tells the room in two numbers which lever the company is actually running on.
Reading price at scale: eCPM up top, fill at the desk
Book 1 gave you RPM = eCPM × fill at the level of a single auction. At platform scale the read changes altitude, and you need to know which number lives at which altitude.
At the board level, the price read is eCPM — the average price per ad — the same thing Meta publishes as “average price per ad,” the same thing you compare against Google’s search-auction yield. That is the number that tells you whether your demand is getting denser and your auction smarter, aggregated across every surface and geo. Google/Alphabet is the benchmark to hold it against: Google advertising revenue was ~$264.9 billion for FY2025, with Q4 2025 ad revenue of $82.3 billion (+14% YoY) (Alphabet Q4/FY2025 earnings, Jan-Feb 2026) — still the largest single ad platform, and the price-side yardstick for any leader’s eCPM trajectory. (Worth marking, because your board will: eMarketer projects Meta to overtake Google in net worldwide ad revenue for the first time in 2026 — Meta ~$243B vs Google ~$239.5B — though for 2025 actuals Google still led, ~$214B vs ~$196B. Forecast; eMarketer Oct 2025.)
At the launch desk, fill and sell-through are diagnostics — they tell an IC whether a single owned auction is clearing its inventory, and they roll up into the platform eCPM but they are not a number you put on a board slide. A surface running at 70% fill is an operational problem for a launch desk; the board only ever sees the aggregate price-per-ad it eventually contributes to.
The discipline this enforces: when ad revenue moves, the same change reads differently at each altitude. Meta’s FY2025 +9% average price per ad is the platform price read; the fill rate on any one of its owned auctions is the IC-level diagnostic that rolled up into it. Confusing the two — bringing a fill-rate chart to the board, or arguing platform strategy off a single auction’s sell-through — is one of the fastest ways a new leader loses the room.
Same-Lever Scorecard
The same decision — primary growth lever and ad-load posture — looks different at every platform. Read this as the field you are competing in.
| Platform | Primary growth lever | Ad-load posture | Tell-tale figure (dated) |
|---|---|---|---|
| Meta | Balanced, price-tilting | Disciplined; leans on new surfaces (Reels) over feed cranking | FY2025 impressions +12% / price +9% → +22%; DAP +7% (Q4/FY2025, Jan 2026) |
| Price — professional-intent density | Light load; monetizes intent, not attention volume | Ad rev ~$8.2B 2025, ~+18%; total >$5B/qtr (Dec-2025 qtr, +11% YoY) | |
| TikTok | Volume (surfaces: Shop, Smart+) on dense US engagement | Expanding via commerce surfaces, not just feed | US ~10% users / ~41% of ad revenue; US user ~4x global value (eMarketer 2025) |
| Google / YouTube | Price (search auction yield) + volume (YouTube as new TV surface) | YouTube adds ad-supported time at TV-budget scale | Google ads ~$264.9B FY2025; YouTube |
| Amazon | Price — demand density on purchase intent | Load constrained by retail UX; price carried by intent | FY2025 ad rev ~$68.6B; Q4 $21.3B (+22% YoY); ~$69B run-rate by Q1 2025 |
| Reddit (wildcard) | Price — pure yield, not user adds | Raising yield faster than load or users | FY2025 ad rev ~$690M (+75%); Q4 ARPU ~$5.98 (+42% YoY) |
The pattern worth naming for your board: the most durable franchises (Amazon, LinkedIn, Reddit, increasingly Meta) grow on price, and the volume growth that is healthy comes from genuinely new surfaces (YouTube as a TV-budget destination, TikTok Shop) rather than from loading the existing feed harder. The triopoly backdrop sharpens the stakes — Meta, Google, and Amazon are projected at ~62.3% of worldwide digital ad spend in 2026 (eMarketer 2025-2026 forecast) — which means the price-side incumbents are entrenched, and a challenger trying to win on volume alone is fighting the hardest version of the fight.
Where Northwind sits
Keep your recurring large commerce advertiser, Northwind, in frame, because Northwind’s money sits on the price side of your P&L. As a DTC-plus-B2B commerce buyer, Northwind pays you for purchase and professional intent — exactly the demand-density that lifts the price term, not the cheap volume that fills the bottom of the auction. This is why the Amazon model is the canonical price story: retail-media ads attached to purchase intent (FY2025 ad revenue ~$68.6B, more than 2x its size four years earlier; Amazon Q4 2025 earnings, Jan-Feb 2026). When you reach for ad load to make a quarter, you risk pushing Northwind’s impressions into lower-quality slots and watching its measured return slip — and an advertiser whose ROI slips is an advertiser shopping for the exit. The price lever keeps Northwind paying more for the same inventory because the inventory got smarter, not more crowded. That is the version of growth Northwind will fund for years; the volume-via-ad-load version is the one that eventually makes Northwind defect.
Decision or Diagnostic?
The single most common failure of a newly promoted leader is bringing IC instrumentation to a board, or letting board metrics dictate launch-desk work. Sort them once and hold the line.
| Board-level DECISIONS (you own these) | IC DIAGNOSTICS (the launch desk owns these) |
|---|---|
| ARPU / ARPP (with the right denominator and by geo) | Win-rate on a given auction |
| Ad load per surface (and expansion plan) | Estimated action rate / predicted CTR |
| eCPM / average price per ad (platform price read) | Single-campaign ROAS |
| Retention / DAP (the engagement base) | Single-auction fill / sell-through |
| Volume-vs-price growth mix | Per-surface latency, bid-shading deltas |
The test for which column a metric belongs in: would the board change a resource decision on it? ARPU by geo changes where you invest — board. A single campaign’s ROAS changes how one launch manager tunes one line item — desk. Note that the entire left column is exactly the set Meta itself reports publicly — impressions growth, average price per ad, ARPP, DAP — and none of the right column ever appears in its earnings release (Meta Q4/FY2025 earnings, Jan 2026). That is not an accident; it is the empirical template for what a monetization P&L looks like at board altitude.
The leader’s call. Maya’s first budget review comes down to one sentence she has to defend: next year, do we grow primarily on volume or on price? The honest read of her surfaces is that the mature feed is near its ad-load ceiling — leaning on volume there would buy a quarter and cost the year’s engagement — while her demand is rich enough to deepen. So she budgets price-led growth on the mature surfaces (auction tuning, demand density, better signal, keeping Northwind paying more for the same inventory) and reserves volume growth for genuinely new surfaces (commerce and video formats that add impressions without taxing the existing feed). She explicitly refuses to fund the quarter with a feed ad-load bump. Real platforms have resolved it this way: Meta’s FY2025 was carried more by price and new surfaces than by feed loading (DAP +7% against ad revenue +22%), and Reddit’s 75% ad-revenue growth came almost entirely from yield, not user adds (Jan 2026). The four-quarters-out consequence Maya is buying: ARPU rises on a stable engagement base instead of a shrinking one, and Northwind’s measured return holds — so it spends more, not less. The version she rejected — volume via ad load — would have shown the same Q1 number and quietly drained both the engagement base and advertiser trust by Q4. Same headline growth, opposite balance sheet four quarters out.
Key terms
| Term | One-line definition |
|---|---|
| Revenue identity | revenue = impressions × price; fuller form, users × time × ad load × price |
| Volume lever | Growing revenue by adding impressions (ad load, new surfaces, user/time) |
| Price lever | Growing revenue by raising yield per impression (auction, demand density, signal) |
| Ad load | Ads served per session/surface — the dial you most directly own and the riskiest |
| Demand density | How many advertisers compete per slot; the engine of the price lever |
| Monetizable engagement | The slice of attention attached to commercial/professional intent that advertisers pay against |
| ARPU | Average revenue per user (denominator varies by platform; read by geo) |
| ARPP | Average revenue per person (Meta’s metric, monthly-active denominator) — not interchangeable with ARPU |
| Four-quarters-out test | Does this move raise ARPU and advertiser trust together four quarters from now? |
| Decision vs diagnostic | Board-level numbers that change resource decisions vs IC numbers that tune one auction/campaign |
Recap & what is next
- Your whole P&L reduces to one identity — revenue = impressions × price — and your job is to choose, every year, how much growth comes from each term.
- There are two levers: volume (impressions) and price (yield). Price compounds and bills the advertiser; volume via new surfaces is cheap, volume via ad load is the most expensive growth there is.
- Ad load is the dangerous dial: engagement returns are logarithmic, so past the inflection every incremental impression costs more future engagement than it earns present revenue. Apply the four-quarters-out test.
- Price the monetizable engagement, not raw users or time — the same user-minute is worth ~4x more in the US than the global average on TikTok, and ARPU is a geography (US & Canada ~16x Rest of World on Meta), so volume-vs-price is really a geo-mix choice.
- Keep ARPU and ARPP straight (different denominators), and keep board decisions (ARPU/ARPP, ad load, eCPM, retention) separate from launch-desk diagnostics (win-rate, action rate, single-campaign ROAS, fill).
Chapter 3 — Where the Money Lives — takes the geo and surface mix you just discovered hiding inside the price-vs-volume choice and makes it the explicit decision: read revenue by geography and by surface, and decide where to fund demand density and pricing infrastructure versus where to simply harvest for reach.