The promise. In Chapter 4 you set the auction’s policy — the user-value weight, the reserves, the mechanism — and learned that the auction is only as good as the Estimated Action Rate feeding it. That number does not come from the auction. It comes from a recommendation-and-ranking stack that has quietly become the single most expensive, most defensible asset on your platform. This chapter equips you to make the call the auction-tuning chapter left open: how much capital to put behind foundation-model-scale recommendation infrastructure and custom silicon, and how to defend that ask to a board that still thinks the moat is your targeting graph. It moved. A decade ago durable advantage came from knowing who the user was — the identity and interest graph no rival could rebuild. Today that graph is necessary but no longer sufficient; the edge has migrated to who can predict best, at the lowest latency, at the largest scale. Your job is to recognize the migration before your competitor’s capital does, value a one-percent model gain correctly, and decide whether to fund the frontier or cede it.
You will be able to:
- Explain the retrieval-then-ranking funnel and why a single-digit-percent model gain is worth billions at platform scale.
- Make the build/own/spend case for unified foundation models and custom accelerators as a revenue lever, not a cost center.
- Decide whether to fund the infra-efficiency roadmap or cede the frontier — and reason about the consolidation risk that creates.
- Reason about retiring fragmented per-surface models in favor of consolidated multi-domain networks, accepting migration risk for capacity.
- Distinguish the infra decisions a board owns (capital ask, build-vs-buy, talent posture) from the diagnostics an ML team tunes (recall, QPS, MFU).
- Connect an ML-infrastructure investment to its four-quarters-out effect on ARPU and advertiser trust.
Builds on: Book 1 ch3 (how an auction clears) and ch5 (floors and the yield curve); Book 2 ch4 (the auction is your policy, and the Estimated Action Rate the auction depends on). It is the second chapter of Part II — The Core Engine — and it funds the prediction quality that makes Chapter 4’s auction policy actually clear at the right price. Chapter 6 will then take the steered output of this stack and decide how much of it to hand the advertiser as an automated black box.
The call on Maya’s desk
Three months in, Maya’s CFO forwards her a single slide from the annual planning deck with a one-line note: “Ads infra capex ask is up 60% YoY. Most of it is GPUs and a custom-silicon line item I don’t recognize. Defend it or cut it before the board sees it.”
The number is enormous and it is not obviously revenue. It is thousands of accelerators, a multi-year custom-chip program, and a request to retire a fleet of models that currently work. Every instinct in a finance org reads this as cost. Maya’s job this chapter is to reframe it as the opposite: the highest-return revenue investment on the slide, sized by a math the CFO has never been shown.
Her tour at the challenger sharpens the stakes. There, the moat was the targeting graph — a distinctive interest signal that let a 500M-user platform punch above its weight on relevance. But she watched that edge erode the moment the larger players threw foundation-model-scale compute at the same problem: their worse graph, run through a better model, started beating her better graph run through a worse one. The lesson she carries into this room is blunt: a targeting-data advantage is a stock that depreciates; a modeling-and-compute advantage is a flywheel that compounds. The moat migrated, and the platforms that noticed late paid for it in ARPU.
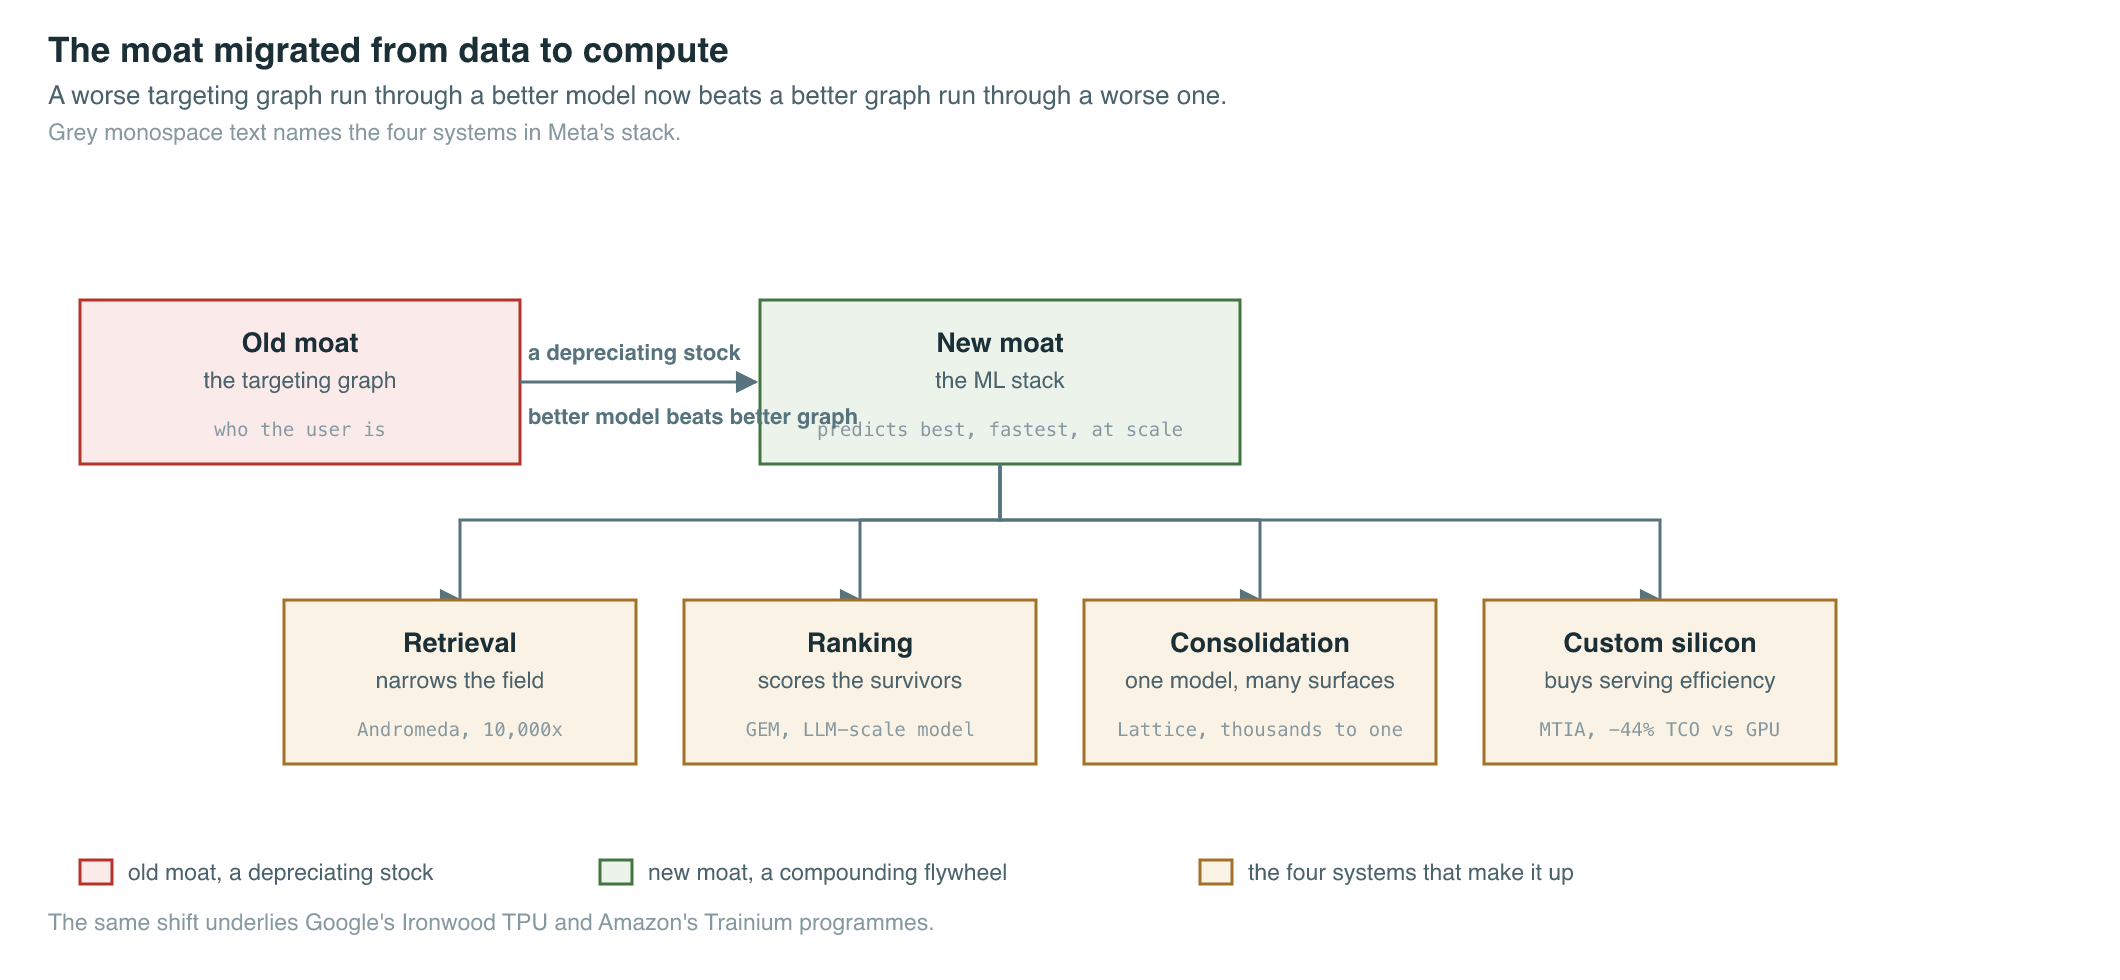
Figure 5.1 — Where the moat went. Identity/interest data is now table stakes; the durable, compounding advantage is the vertically integrated prediction-and-compute stack that turns that data into accurate, low-latency Estimated Action Rates.
The funnel: retrieval, then ranking
To value the ask you must first see the machine it funds. Modern platform ad serving is a two-stage retrieval-then-ranking funnel — a lightweight first stage that narrows a candidate pool of tens of millions of eligible ads down to a few thousand, followed by a high-capacity second stage that scores those few thousand to pick the winner that enters the auction (Engineering at Meta, 2024–2025). The split exists because of physics: you cannot run your most expensive model on tens of millions of candidates inside a latency budget measured in tens of milliseconds, but you can run a cheap model on everything and an expensive model on the survivors.
Meta’s stack is the most fully documented instance, so use it as the depth case:
-
Retrieval — Andromeda. Announced December 2024, Andromeda is Meta’s personalized-ads retrieval engine. It increased retrieval-model capacity roughly 10,000× via sublinear-cost deep networks, delivering +6% recall and +8% ad quality on selected segments, 3×+ higher end-to-end inference QPS (Queries Per Second — the throughput of ad-serving infrastructure), and ~100× faster feature extraction versus the prior CPU components (Engineering at Meta, Dec 2024). It runs on NVIDIA Grace Hopper Superchips with planned MTIA (Meta Training and Inference Accelerator — Meta’s custom ad-ranking silicon) integration. The mechanism that matters for the leader: Andromeda replaces the old approximate-nearest-neighbor retrieval with deep, jointly trained index-and-retrieval networks, so candidate selection is now a learned, compute-bound prediction rather than a lookup — which is why a richer model (not just a richer targeting graph) increasingly decides who is even eligible to be shown. (The Dec 2024 post documents the retrieval-network mechanism; it does not itself claim computer-vision analysis of the creative — re-verify before attributing creative-level signals to Andromeda specifically.)
-
Ranking — GEM. Detailed November 2025, GEM (Generative Ads Recommendation Model) is the ranking brain above Andromeda’s retrieval — described by Meta as its largest foundation model for ads recommendation, trained at LLM scale (Meta likens the compute to that of a modern ChatGPT-class LLM) across thousands of GPUs. It acts as a central “teacher” that transfers knowledge to hundreds of vertical, user-facing models. Reported gains: +5% ad conversions on Instagram and +3% on Facebook Feed since Q2 2025, roughly 4× more efficient at driving performance gains for a given amount of data and compute than prior ranking models, with a 23× increase in effective training FLOPs (and a 1.43× MFU gain) while using 16× more GPUs; Meta says a Q3 2025 architecture change roughly doubled the benefit per unit of data and compute (Engineering at Meta, Nov 2025; vendor-reported, fast-moving — re-verify).
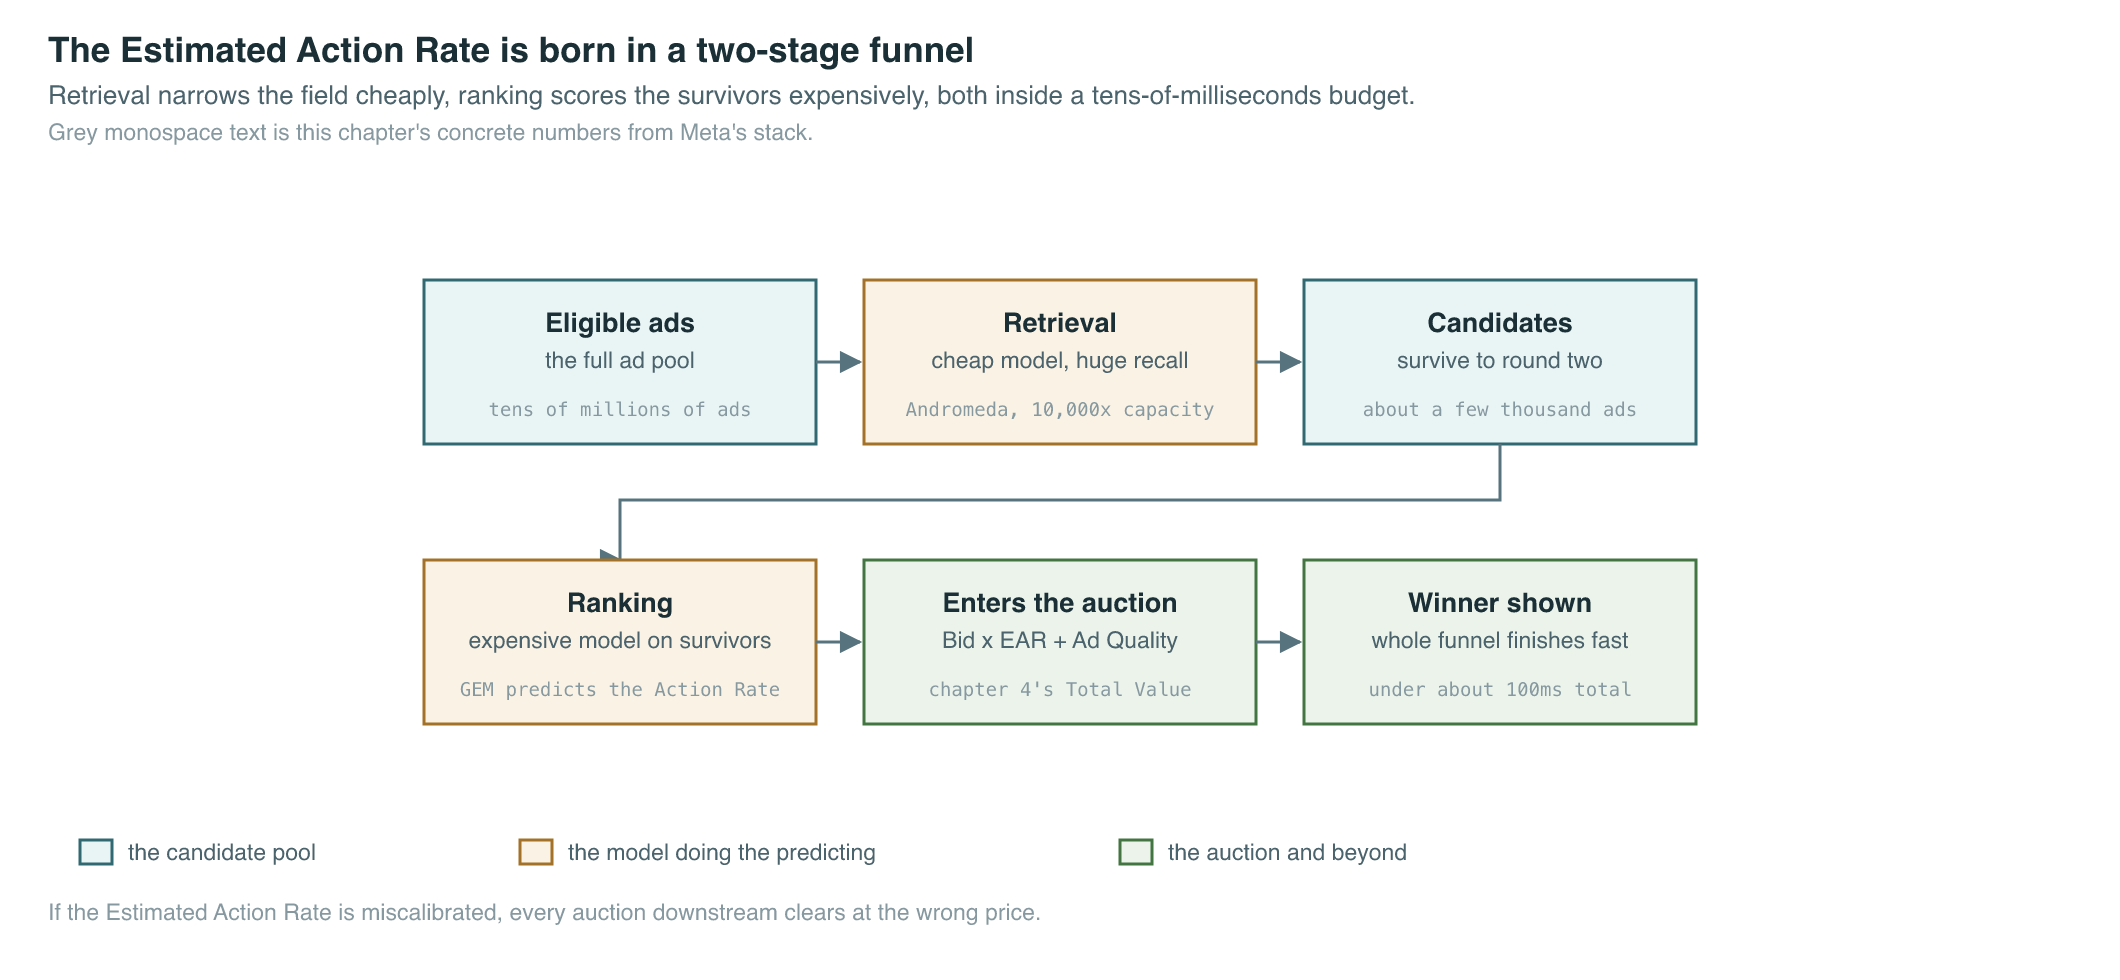
Figure 5.2 — The retrieval-then-ranking funnel that feeds Chapter 4’s auction. Retrieval narrows the field cheaply; ranking scores the survivors expensively; both must finish inside a tens-of-milliseconds budget. The latency budget is itself a monetization gate — capacity you cannot serve in time is revenue you cannot bill.
The point for the leader: this funnel is where the Estimated Action Rate is born. Chapter 4 told you the auction prices an impression as Bid × Estimated Action Rate + Ad Quality. If your EAR is even slightly miscalibrated, every auction in your platform clears at the wrong price — you either under-monetize good impressions or over-serve bad ones and erode the engagement you spent Chapter 4 protecting. The ML stack is not adjacent to the auction. It is the auction’s eyesight.
How to value a one-percent model gain
Here is the math the CFO has not been shown, and the heart of the chapter. At platform scale, a single-digit-percent model improvement is not a rounding error — it is one of the largest revenue line items you can buy.
The arithmetic is brutal and simple. Meta’s Family-of-Apps ad revenue ran $55.0B in Q1 2026 alone, up 33% YoY (Meta Q1 2026 results, Apr 2026) — call it well north of $200B annualized. A model change that lifts ad conversions even 1% does not lift one campaign; it lifts the conversion rate across trillions of ranked impressions served to ~3.5B daily users. On a $200B+ base, a clean 1% improvement is on the order of $2B of incremental annual revenue — from one model release. GEM’s reported +5% on Instagram and +3% on Feed, taken at face value, are multi-billion-dollar events. (These are vendor-reported, segment-specific figures — re-verify and never quote the lift as if it applied uniformly to the whole base.)
That is why the infra ask is mispriced as a cost. Frame it the way Maya will frame it to the board:
A 1% conversion-model gain on our ad base is worth roughly $2B a year, recurring. Our ranking roadmap projects several points of gain over the plan horizon. The GPU and custom-silicon line the CFO flagged is the price of capturing those points before a better-capitalized rival captures them instead. This is not capex against a cost center; it is the unit economics of buying revenue at a discount.
Two qualifications keep this honest, and a leader who skips them gets caught:
- Gains are not additive forever. Each successive point is harder won; the curve flattens. Underwrite the next point, not an extrapolation of the last one.
- Lift is not incrementality. A reported conversion lift is the model’s claim; the true causal lift (Chapter 7’s subject) is usually smaller. Value the gain at a haircut, and make your ML team show calibration, not just recall.
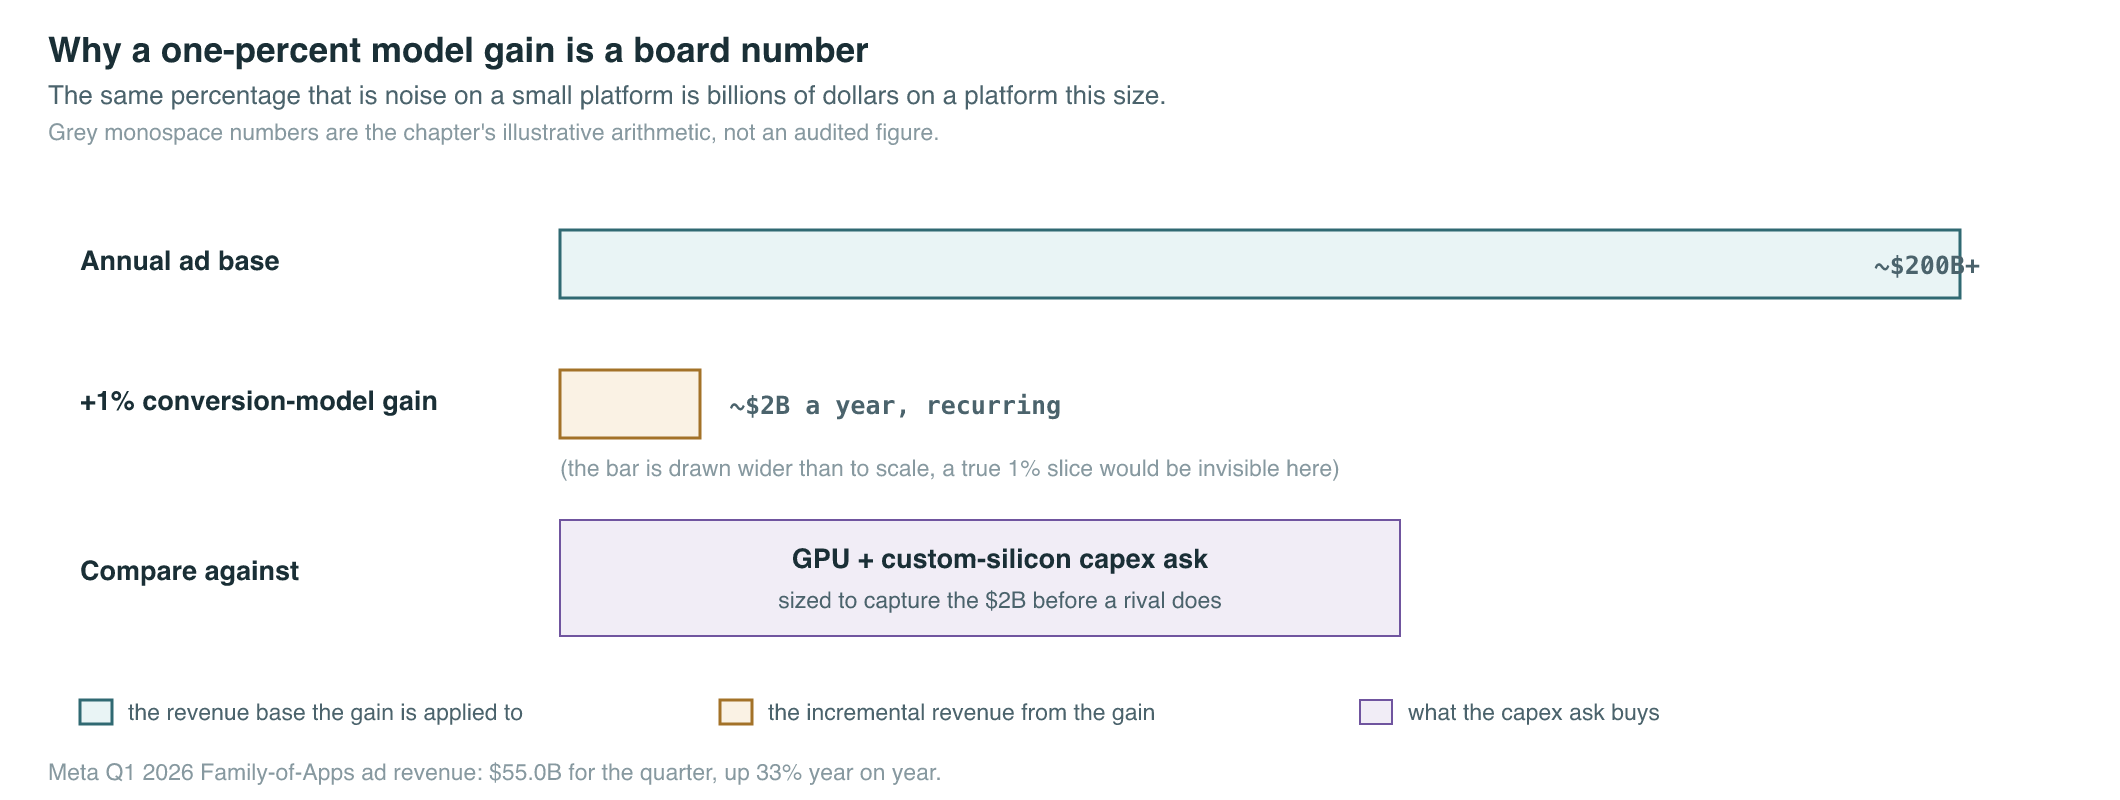
Figure 5.3 — Why a one-percent model gain is a board-level number (illustrative). The scale multiplier is the whole argument: the same percentage that is noise on a small platform is billions on a large one. This is also why the moat compounds — the bigger your base, the more a model point is worth, so the more you can afford to spend chasing it.
Custom silicon: when compute efficiency becomes the lever
The line item the CFO did not recognize is custom silicon, and it deserves its own decision. Once you accept that model gains are worth billions, the binding constraint becomes how much model you can afford to serve inside the latency budget. That constraint is set by your compute — and increasingly by whether you own it.
Meta’s answer is MTIA, its custom ad-ranking-and-recommendation accelerator. By 2026 Meta had MTIA generations in production and, in partnership with Broadcom, had laid out a roadmap to develop four further chip generations over roughly two years — a “new chip every six months or less” cadence versus an industry norm of one-to-two years (Meta / about.fb.com & Broadcom, 2026; forward-looking roadmap — re-verify). MTIA is reported to cut total cost of ownership ~44% versus GPUs on supported models and run ~40% more power-efficiently than an H100 on recommendation workloads, with the ASIC caveat that those wins hold on the low-to-medium-complexity models the chip was designed for, not on every workload (vendor-reported, fast-moving — re-verify). Google’s parallel move is the Ironwood TPU (seventh generation, late 2025), built with an enhanced SparseCore specifically to accelerate the ultra-large embeddings that ranking and recommendation models depend on, scaling to thousands of chips per pod (Google Cloud, 2025–2026).
Read the strategic logic, not the spec sheet. Custom silicon is a bet that compute efficiency is a revenue lever: every percent of cost or latency you take out of serving is either margin you keep or model capacity you can redeploy to win another conversion point. A platform that pays full retail GPU prices and serves a smaller model inside the same latency budget is, in effect, choosing to monetize worse than a rival who designed its own chip. That is the consolidation risk in one sentence — and it is the heart of Maya’s defense of the line item.
But silicon is also where the build/own/spend decision bites hardest, because it is the least reversible. The honest framing for the board:
- Build (own silicon): highest upside on efficiency and the deepest moat, but enormous fixed cost, multi-year payback, and a talent requirement that puts you in a war with the frontier labs for chip and ML-systems engineers. Defensible only at the scale where a fraction of a percent of serving cost is itself a nine-figure number.
- Spend (rent best-in-class GPUs): fastest to capability, no fixed-cost trap, but you compete on a cost base anyone with a credit card shares — and you are a price-taker to your supplier.
- Cede (under-fund the frontier): the quiet default that looks prudent for four quarters and then shows up as a permanent relevance and yield gap you cannot close, because the leaders’ flywheel has spun further while you saved money.
Consolidation: retiring the models that work
The third piece of the ask — retiring a fleet of models that currently work — is the one most likely to get cut by an executive who confuses “working” with “optimal.” It is also where the largest efficiency wins hide.
For years, platforms ran fragmented per-surface models: a separate ranking model for Feed, another for Reels, another for Stories, multiplied across objectives — thousands of models, each independently trained, maintained, and serving. It felt safe; each surface had a model tuned to it. It was also a tax: duplicated infrastructure, no shared learning across surfaces, and a maintenance burden that grew with every new surface.
Meta’s Lattice is the consolidation play — collapsing what Meta describes as thousands of separate, surface-siloed ad models into a small set of unified Multi-Domain, Multi-Objective (MDMO) networks. Reported results: ~10% top-line metric gain, ~6% conversion-rate lift, ~20% capacity savings (and an ~11.5% user-satisfaction gain) (Meta AI / “Meta Lattice” paper, 2024–2025; vendor-reported — re-verify). Consolidation wins twice: it saves capacity (one big model is cheaper to serve than a hundred small ones) and it improves prediction (a model trained across all surfaces learns patterns no single-surface model ever sees).
The decision the leader owns is the trade: migration risk now for capacity and accuracy later. Consolidating live ranking models is open-heart surgery on the revenue engine; a botched migration can dent conversions across every surface at once. The call is not whether consolidation is better — at scale it clearly is — but whether your org can execute the migration without a revenue-denting outage, and whether you can stage it surface by surface. That is a judgment about engineering maturity and rollback discipline, and it sits with the leader, not the IC who wants to ship the elegant unified model on Friday.
Same-Lever Scorecard
The same decision — how far to vertically integrate the prediction-and-compute stack, and whether to build, spend, or cede on the frontier — across the majors. Figures dated and hedged inline.
| Platform | The ML-stack lever | Custom silicon posture | Consolidation / scale tell | Read for the leader |
|---|---|---|---|---|
| Meta | Andromeda retrieval + GEM ranking (LLM-scale recsys foundation model) + Lattice consolidation | Build — MTIA in production + a 4-generation roadmap w/ Broadcom; ~44% TCO cut vs GPU (2026, vendor-reported / forward-looking) | Lattice: thousands of per-surface models → unified set; ~20% capacity savings, ~6% conversion-rate lift (Lattice); GEM ranking adds +5% IG conversions | The full vertical-integration playbook; the benchmark others are priced against |
| Google / YouTube | Embedding-heavy ranking; Ironwood TPU SparseCore for recsys | Build — TPU line, Ironwood (Gen 7) tuned for ranking embeddings (2025–2026) | Decade-deep TPU + recsys; scale at search-volume | Proof the build case is durable when your base is the largest ad business on earth |
| TikTok / ByteDance | Recommendation engine is the product; Smart+ rides it | Spend/Build hybrid — heavy GPU + in-house silicon ambitions, constrained by export controls | World-class recsys at challenger-to-Meta scale | Modeling edge as core identity — but the US-JV algorithm-retraining overhang is a stack risk (fast-moving) |
| Amazon | Closed-loop, purchase-data ranking; Trainium/Inferentia | Build — Trainium/Inferentia accelerators | First-party purchase signal makes EAR unusually accurate | The data moat plus a silicon program; ~$56B ad rev FY2024 funds both (Amazon FY2024) |
| Relevance ranking on a verified professional graph; leans on Microsoft/Azure compute | Spend — rides parent’s (Microsoft) infra | Data depth, not compute scale, is the differentiator | The case that a deterministic graph can substitute for some raw model scale in B2B | |
| The Trade Desk (wildcard) | Kokai AI buying on the open internet (>70% of spend, Q2 2025) | Spend — no owned silicon; buys compute | AI buying without the walled-garden data/compute flywheel | The independent contrast: how a non-garden competes when it can’t build the full stack |
Decision or Diagnostic?
Sort the chapter’s metrics by altitude. The leader owns the capital and structural calls; the ML team owns the knobs that implement them.
| Decision (board / leader owns) | Diagnostic (ML team / launch-review owns) |
|---|---|
| The infra capital ask — how many billions to put behind GPUs + custom silicon as a revenue investment | Recall / +6% retrieval recall — the retrieval model’s candidate-quality metric |
| Build vs spend vs cede on custom silicon — own the chip, rent the GPU, or under-fund | QPS / throughput — ad-serving inference rate; an ops health metric |
| Whether to retire fragmented models — accept migration risk for capacity + accuracy | MFU / training throughput (23×) — hardware-efficiency and training-speed metrics |
| The value placed on a 1% model gain — the conversion-to-dollars multiplier that sizes the whole budget | Per-release conversion lift on a segment — the model team’s launch metric, pre-haircut |
| Talent posture — how hard to compete in the AI-infra hiring war | Latency-budget headroom — the engineering margin within the serving SLA |
The leader’s call. The trade-off you own is how much capital to lock into a vertically integrated prediction-and-compute stack you cannot easily unwind, against the certainty that a better-capitalized rival is locking in theirs. The trap is that the ML stack reads as cost on every finance slide while it is, at scale, the highest-return revenue lever you have — a 1% conversion-model gain on a $200B+ base is ~$2B a year, recurring, and the moat compounds because the bigger your base the more each model point is worth. Meta resolved it by building the full stack — Andromeda retrieval, GEM ranking, Lattice consolidation, MTIA silicon — and treating single-digit-percent model wins (+5% IG, +3% Feed; vendor-reported) as the multi-billion-dollar events they are; Google made the same build bet a decade deep with TPU/Ironwood. The cautionary read is the cede path: it looks prudent for four quarters, then shows up as a permanent relevance-and-yield gap you cannot close because the leaders’ flywheel spun further while you saved money. Four quarters out: fund the stack and you lift the Estimated Action Rate feeding every auction, which lifts ARPU through better-priced impressions and advertiser trust through better-performing ads — the same loop Chapter 4 was protecting. Under-fund it and you book a cheaper plan this year, then watch your eCPM and your advertisers’ ROAS quietly erode against rivals whose models simply predict better. The moat migrated; pay to defend it on the new ground, not the old.
Key terms
| Term | One-line definition |
|---|---|
| Retrieval-then-ranking funnel | Two-stage serving: a cheap model narrows tens of millions of candidates to a few thousand; an expensive model scores those to pick the winner. |
| Andromeda | Meta’s GPU/MTIA-accelerated ads retrieval engine; ~10,000× capacity, +6% recall, replacing approximate-nearest-neighbor lookup with jointly trained deep index-and-retrieval networks. |
| GEM | Generative Ads Recommendation Model — Meta’s LLM-scale ranking foundation model; the “teacher” feeding hundreds of vertical models. |
| Lattice | Meta’s model-consolidation effort: thousands of per-surface models collapsed into a small set of unified multi-domain, multi-objective networks for capacity savings and cross-surface learning. |
| MTIA | Meta Training and Inference Accelerator — Meta’s custom ad-ranking silicon; the build-your-own-chip bet on compute efficiency as a revenue lever. |
| GH200 | NVIDIA Grace Hopper Superchip — the GPU platform underpinning Andromeda before/alongside MTIA. |
| QPS | Queries Per Second — throughput of the ad-serving infrastructure; a diagnostic, not a board metric. |
| Compute as a revenue lever | The thesis that every percent of serving cost/latency removed is margin kept or model capacity redeployed to win another conversion point. |
| Latency budget | The tens-of-milliseconds the funnel has to finish; capacity you cannot serve in time is revenue you cannot bill — a monetization gate. |
| Model consolidation | Retiring fragmented per-surface models for unified networks: migration risk now for capacity and accuracy later. |
Recap & what is next
- The moat migrated. Durable advantage moved from the targeting graph (a depreciating data stock) to the ML stack (a compounding prediction-and-compute flywheel); a worse graph run through a better model now beats the reverse.
- The funnel is the auction’s eyesight. Retrieval (Andromeda) then ranking (GEM) produce the Estimated Action Rate that Chapter 4’s auction prices on — miscalibrate it and every auction clears at the wrong price.
- A 1% model gain is a board number. On a $200B+ base across trillions of impressions, one conversion point is ~$2B a year — so the infra ask is mispriced as a cost; value it as revenue bought at a discount, at a haircut for incrementality.
- Custom silicon is the build/spend/cede call. MTIA and Ironwood make compute efficiency a revenue lever; building is defensible only at the scale where a fraction of a percent of serving cost is nine figures, and ceding is the prudent-looking default that becomes a permanent gap.
- Consolidation wins twice but cuts deep. Unifying per-surface models (Lattice: ~20% capacity savings, +6% conversions) saves compute and improves prediction — but the leader owns the migration-risk judgment, not the elegance of the unified model.
- Sort the metrics ruthlessly — capital ask, build-vs-spend, model-retirement, the value of a point, and talent posture are yours; recall, QPS, MFU, and per-release lift belong to the ML launch review.
Maya can now fund and defend the stack. But the moment you have a model this good at predicting outcomes, advertisers stop wanting to operate the levers themselves — they want to hand you an objective and let the black box run. Chapter 6 — How Much Control Do You Take Away? — The Automation Frontier takes you there: once the ML stack can target, bid, and place better than any human, the decision becomes how much of that machine to expose as Advantage+/Smart+/Performance Max, what guardrails to keep, and how to price the advertiser-trust cost of opacity.
Sources for this chapter’s fast-moving figures: Engineering at Meta — GEM; Engineering at Meta — Andromeda; Meta — Expanding Custom Silicon (MTIA); Meta + Broadcom MTIA; InfoQ — GEM training; Google Cloud — Ironwood TPU; Google — Ironwood for inference. Revenue and conversion-lift figures are vendor-reported and as-of early 2026 — re-verify before quoting.