The promise. In Chapter 6 you learned to steer price and volume impression by impression — pacing, bid landscapes, ad-load and frequency optimization, the operational yield layer that sits under the P&L. That layer answers how much and how often. This chapter answers the question that decides whether any of that yield survives contact with reality: what are you allowing into the feed, and at what cost to the experience that produces the next impression? Every quarter you will face a quiet, recurring temptation — to under-enforce on a clickbaity, scammy, or merely mediocre demand pool because it bids well and fills inventory today. This chapter equips you to treat ad quality and integrity not as a trust-and-safety cost center bolted to the side of the business, but as a parameter inside the revenue function itself — the same user-value term you met in Chapter 4, now operationalized as a system of scores, demotions, and penalties whose whole job is to keep revenue and experience from diverging. The decision you will own: how hard to enforce, where to set the penalty curve, and how to keep the people who hit the revenue number from quietly competing quality away.
You will be able to:
- Decide how aggressively to demote or penalize low-quality, clickbait, and integrity-violating demand — and defend giving up bookable revenue to do it.
- Reason about why ad quality scoring is an auction input on some surfaces and a diagnostic on others, and why that distinction is a board-level design choice.
- Defend an enforcement tightening that costs short-term revenue as an investment in the engagement and advertiser-trust base that compounds ARPU.
- Distinguish the integrity decisions a leader owns from the quality diagnostics an IC tunes.
- Connect an integrity-vs-revenue call to its four-quarters-out effect on retention, advertiser trust, and regulatory exposure.
Builds on: Book 1 ch8 (brand safety, fraud, and the integrity layer of the open-web supply chain). Within Book 2 it builds directly on ch4 (the user-value term in Total Value) and ch6 (the yield and ad-load layer this chapter constrains). It assumes the Book-1 fundamentals — CPM/eCPM, the auction, attribution — and does not re-teach them.
The call on Maya’s desk
Eleven months in, Maya gets a deck from her integrity lead and a counter-deck from her revenue lead, scheduled back to back. The integrity lead wants to ship a tightened quality classifier in three high-growth Rest-of-World markets: a model that aggressively demotes engagement-bait creative (the “you won’t believe what happened next” school of advertising), low-quality landing-page experiences, and a cluster of borderline-deceptive financial-services advertisers who bid like they print money. The projected cost: roughly −1.4% ad revenue in those markets next quarter, concentrated almost entirely in the demand the classifier demotes.
The revenue lead’s deck is one slide. It says: those markets are where the growth narrative lives this year, the demoted advertisers are net-new spend, and a 1.4% haircut on the fastest-growing pool is exactly the kind of self-inflicted wound that shows up in a board QBR with no offsetting line.
Both are right, which is the whole problem. This is the integrity-vs-revenue divergence — the structural tendency for the revenue-maximizing setting and the experience-maximizing setting to pull apart, slowly, in the direction of more revenue and worse feed. Left to its own incentives, an ads org drifts toward under-enforcement, because the revenue cost of tightening is immediate and legible while the engagement cost of not tightening is delayed and diffuse — the same asymmetry that made the user-value term a leader’s call in Chapter 4. Maya’s job is not to adjudicate the two decks. It is to recognize that she is the only person in the building whose incentives are aligned with both the revenue line and the engagement line, and therefore the only person who can set the enforcement curve without bias.
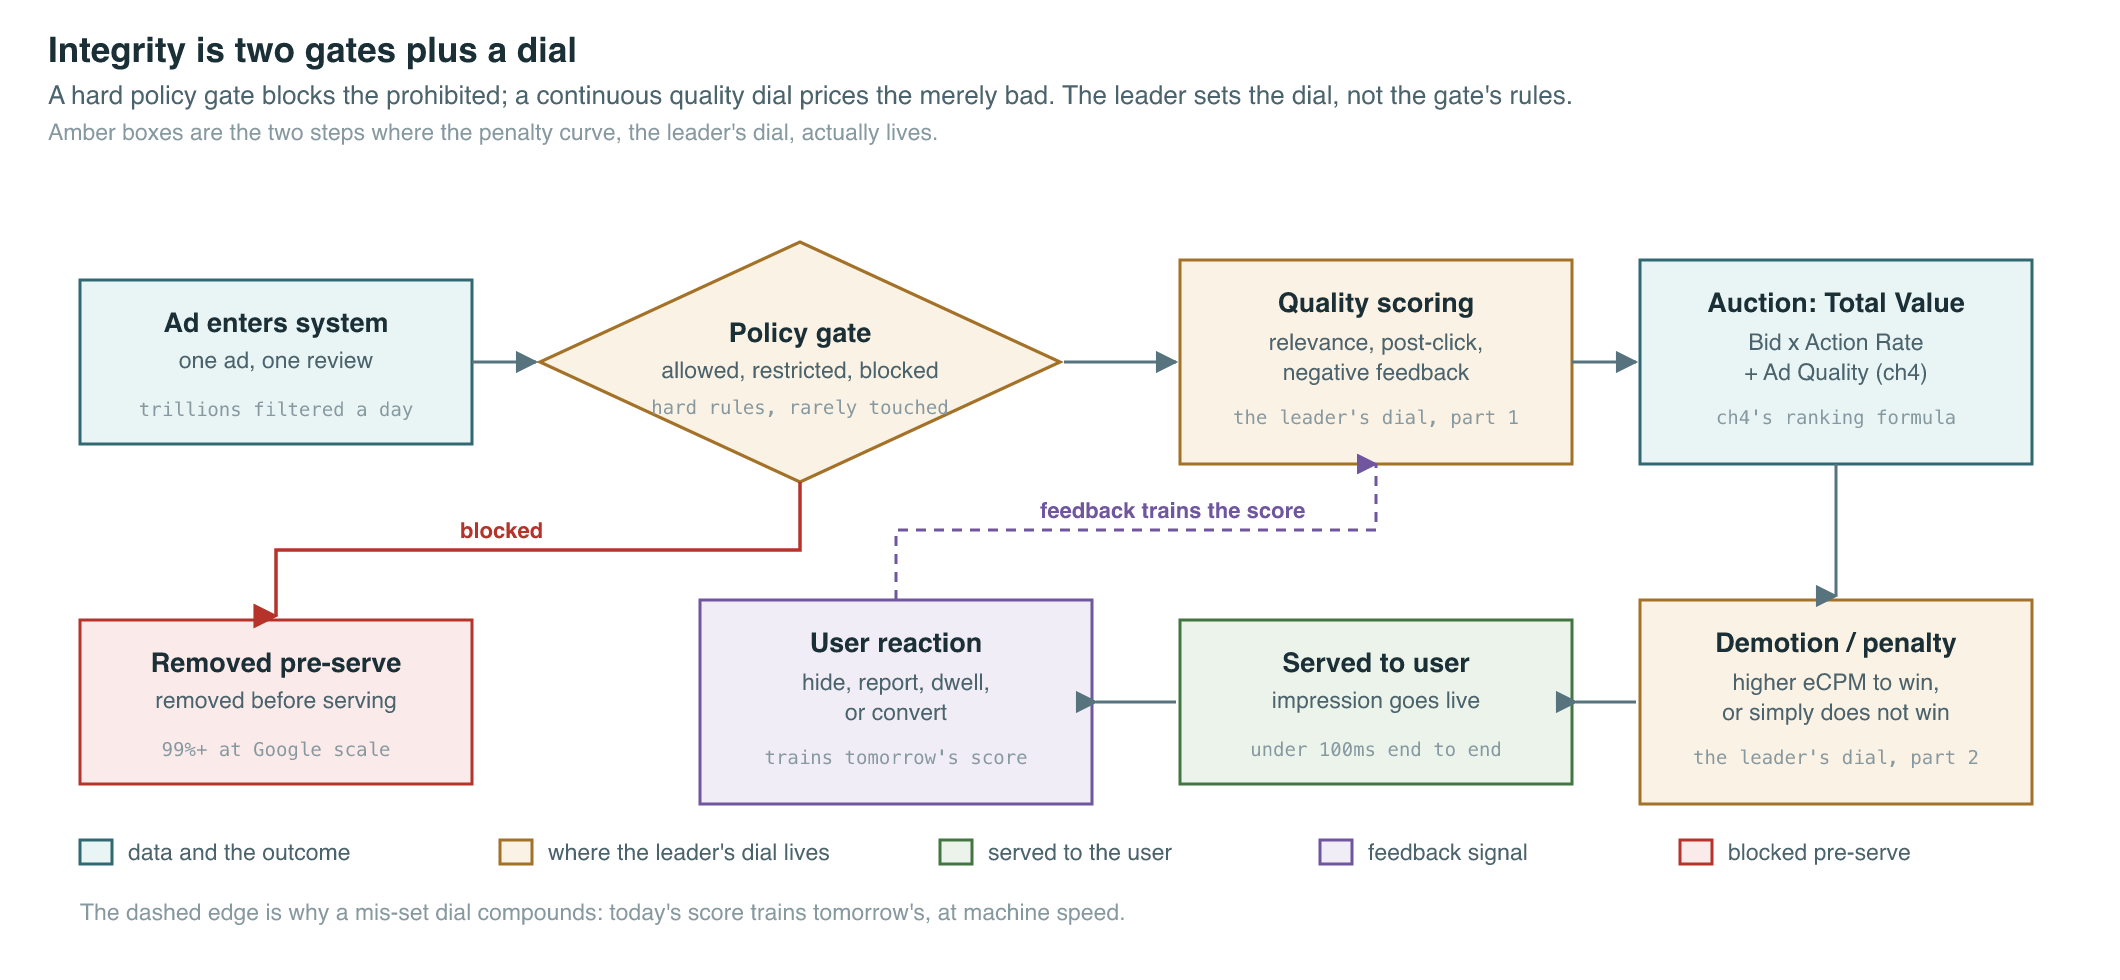
Figure 7.1 — Integrity is two gates plus a dial. A hard policy gate (block the prohibited) and a continuous quality dial (demote the merely bad). The leader rarely touches the gate’s rules; she sets the steepness of the dial — the penalty curve in the boxed steps — and owns where it lands on the revenue-experience frontier.
Quality scoring is the user-value term made operational
Chapter 4 left the user-value term as a single weight in the ranking formula. In production it is not one number; it is a scoring system feeding that weight. Meta’s public ad-quality apparatus is the clearest worked example. Meta scores delivered ads on a relative Quality Ranking — reported to advertisers as above average / average / below average versus ads competing for the same audience — built from negative-feedback signals (hides, reports, “see fewer ads from this advertiser”), low-quality engagement, and engagement-bait or clickbait phrasing (Meta Business Help Center, About Quality Ranking; industry explainers, 2025–2026). A below-average ad doesn’t just rank lower; it is more expensive to deliver — practitioners report low-quality creative paying materially higher effective CPMs to win the same impression, on the order of 15–40% higher in the worst tier (vendor/practitioner estimates — directional, re-verify). That surcharge is the user-value term doing its job: it makes the auction pass the cost of a worse experience back to the advertiser causing it.
Crucially, with Meta’s Andromeda delivery system rolled out globally by October 2025, creative quality became a first-class ranking signal — the system reads the creative content directly rather than inferring quality only from after-the-fact feedback (Engineering at Meta, Andromeda, Dec 2024; global rollout 2025). That is the architectural shift the leader has to understand: quality is moving from a reactive penalty applied after users complain to a predictive input scored before the ad ever serves. The dial gets faster and quieter, which makes who sets it matter more, not less.
There is also an account-level layer. Meta exposes an Account Quality score (a 0–100 health signal per ad account, where sitting below ~70 makes future approvals harder), and 2026 enforcement is described as shifting from reactive review to proactive multimodal AI classifiers scanning every ad before it serves (Meta policy/industry guides, 2026 — fast-moving, re-verify). The leader’s takeaway is not the specific threshold. It is that quality enforcement is becoming a continuous, automated, account-spanning system — which means a single mis-set penalty curve now propagates across the entire marketplace at machine speed.
FIGURE 7.2 (spec): A “penalty curve” line chart. X-axis: an ad’s quality score (low → high). Y-axis: the eCPM cost to win the same impression (indexed, 100 = neutral). Three curves overlaid — “Light enforcement” (nearly flat, low-quality barely surcharged), “Maya’s setting” (a steepening curve that surcharges the bottom tier ~25%), and “Heavy enforcement” (a cliff that effectively excludes the bottom tier). A shaded band marks “low-quality demand priced out.” Caption: “Enforcement is not on/off — it is the steepness of the price low-quality demand pays to win. The leader picks the slope.” Alt-text: “Line chart showing eCPM-to-win rising as ad quality falls, with three enforcement steepness curves.”
Integrity at scale is a manufacturing process, not a courtroom
The instinct of a newly promoted leader is to imagine integrity as adjudication — a queue of hard cases reviewed by smart people. At platform scale that mental model is a trap. The real system is closer to a manufacturing line with a defect-rejection stage: high-volume, automated, optimized for catching the bad before it ships, and measured in rates, not verdicts.
Google’s numbers make the scale concrete. In its 2025 Ads Safety Report (published 2026), Google reported blocking or removing over 8.3 billion policy-violating ads and suspending 24.9 million advertiser accounts, with over 99% of policy-violating ads intercepted before a user ever saw them — enforcement increasingly driven by its Gemini models analyzing “hundreds of billions of signals” to detect malicious intent earlier (Google Ads Safety Report 2025 / blog.google, 2026 — fast-moving). The year prior (2024), Google removed/blocked over 5.1 billion ads and suspended 39.2 million advertiser accounts, including 700,000+ accounts for public-figure impersonation scams, after which user reports of those scams fell ~90% (Google 2024 Ads Safety Report; Search Engine Land, 2025).
Read those two numbers next to each other and the leader’s lesson appears. Account suspensions fell from 39.2M to 24.9M year over year while ads removed rose — not because enforcement got softer, but because catching bad actors earlier in the lifecycle (at intent, pre-serve) means fewer accounts ever get spun up to be suspended later. The integrity system’s quality is measured by how far left in the pipeline it catches harm, not by how many verdicts it issues. A leader who manages integrity by suspension count is optimizing the wrong end of the line.
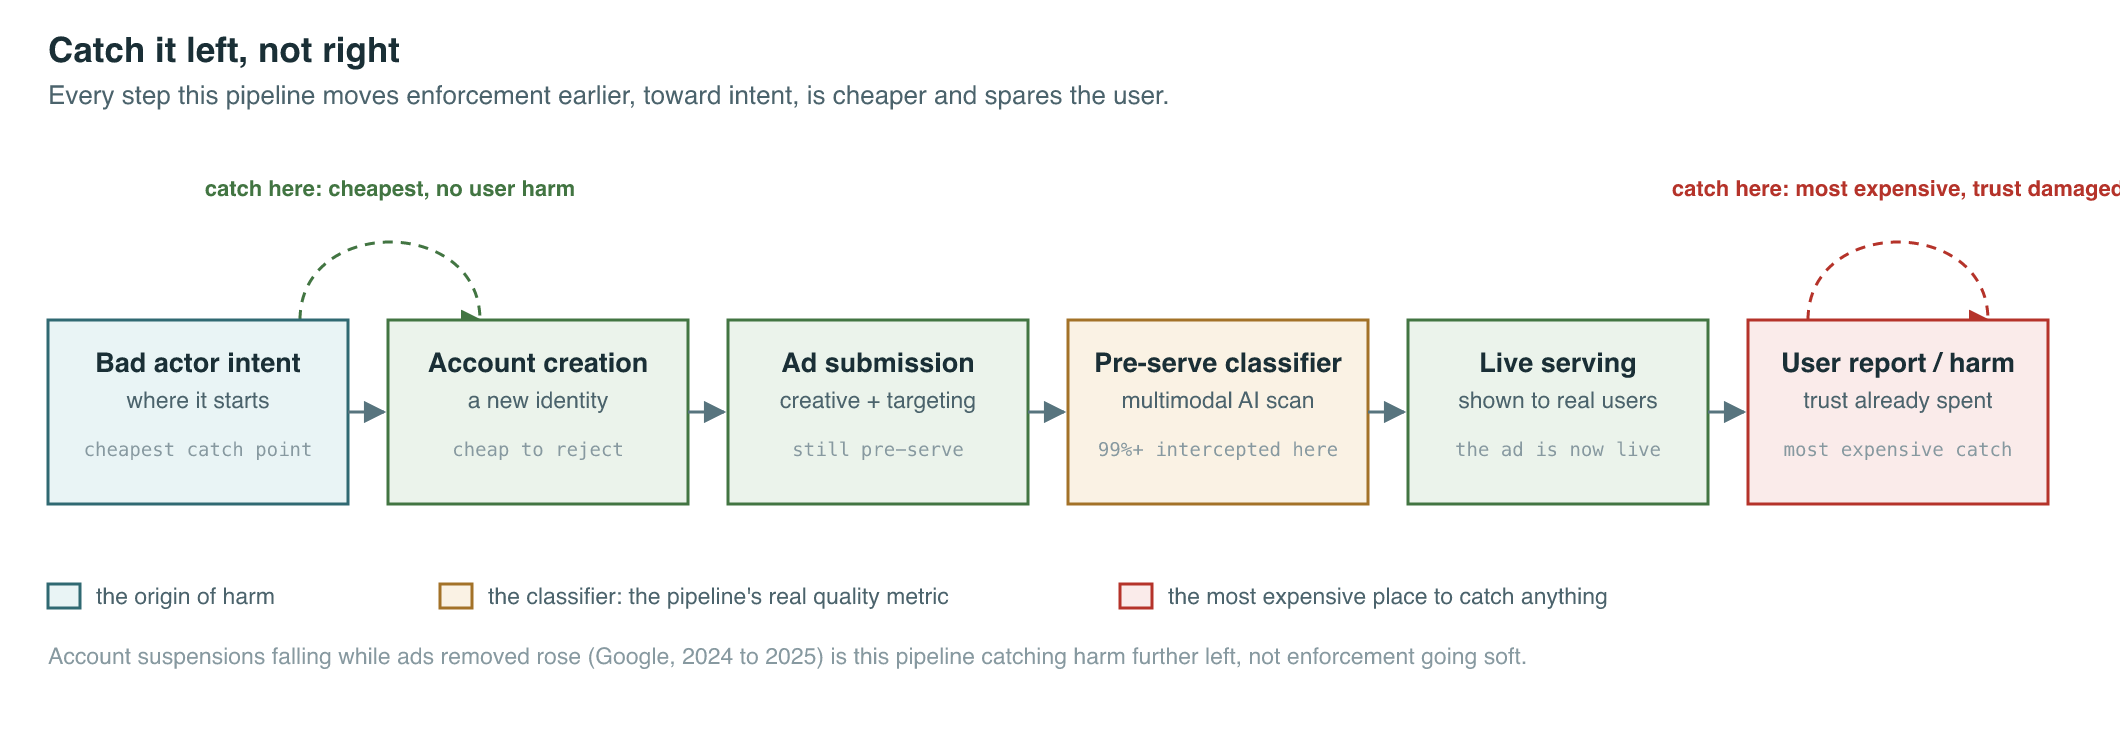
Figure 7.3 — Catch it left, not right. Every step the system moves enforcement earlier (toward intent) is cheaper and spares the user. The 99%+ pre-serve interception rate is the metric that matters; suspension counts are a lagging by-product.
Why X is the cautionary tale of this chapter, specifically
Chapter 4 used X to show that trust is fragile revenue infrastructure. Here the lesson is sharper and more mechanical: X is what the integrity-vs-revenue divergence looks like when it is allowed to run unchecked, and what it costs.
X did not lose advertisers because its auction mispriced impressions. It lost them because the environment around the ad degraded — looser content moderation, brand-unsafe adjacency, and a posture that treated advertiser confidence as negotiable. The result was not a graceful slide but a cliff: X ad revenue fell from ~$4.5B (2022, pre-takeover Twitter) to ~$2.5B (2024) — with total revenue similarly compressed — and anchor advertisers cut to near-zero (Statista / eMarketer / MediaRadar estimates, 2024–2025 — directional, re-verify). Brand-by-brand pullbacks reported by ad-intelligence vendors run in the same direction: large anchor advertisers such as Apple and Microsoft are estimated to have cut X spend by well over 90% from their 2022–2023 levels to a small fraction of a million dollars by 2025 (MediaRadar / press estimates — directional, specific figures vary by source). The recovery has been partial and slow because the thing that broke — confidence that a brand’s ad would not appear next to something that humiliates it — cannot be re-priced. It has to be re-earned, over years, against a memory.
The structural lesson for Maya: integrity is the part of the user-value term that protects the advertiser, not just the user. A clean, well-moderated environment is what lets her command premium eCPMs from brand budgets that have somewhere else to go. Under-enforcement looks free in the quarter she does it and looks like X four quarters later. The penalty curve she sets is, in part, an insurance premium against her own version of that cliff.
LinkedIn is the deliberate counterweight. Sitting on a verified professional graph in a professional context, its integrity surface is structurally smaller and its trust dividend shows up as durable premium pricing — Marketing Solutions ad revenue estimated around $8.2B in 2025 on far fewer, costlier impressions than Meta or Google (vendor/third-party estimate — not separately audited, directional). Same lever, opposite end: where X let the environment degrade and lost the premium, LinkedIn protects the environment and is the premium.
Aligning the incentives so the two do not diverge
The deepest part of this chapter is not the scoring; it is the org design that keeps scoring honest. The divergence is not primarily a modeling problem. It is an incentives problem: if the team that owns the revenue number also owns the enforcement dial, the dial will drift loose, slowly, in defensible increments, each of which “only” costs a fraction of a percent of experience to book a clean revenue win. No one decides to wreck the feed. They optimize it there one quarter at a time.
Three structural moves keep revenue and experience aligned:
- Separate the scorekeeper from the spender. The function that sets and audits the quality/integrity penalty curve should not report into the function carried on a revenue quota. This mirrors the measurement-governance function the book argues for elsewhere: integrity, like measurement, is a standing governance capability, not a feature owned by growth.
- Put a long-horizon metric next to the revenue metric. Meta institutionalizes this by reporting DAP (Daily Active People — ~3.56B in March 2026, +4% YoY) beside ARPP and ad revenue (+33% YoY in Q1 2026) (Meta Q1 2026 results, Apr 2026). When the board sees engagement and extraction side by side, a leader can defend an enforcement tightening as protecting the DAP base that produces tomorrow’s impressions — not as unexplained revenue leakage.
- Make the penalty curve a named, owned decision with a defended setting. Not a model default. A documented choice — here is where we set bottom-tier surcharge, here is the revenue we are knowingly declining, here is the engagement we are buying — reviewed on a cadence, the same way a central bank publishes a rate decision.
Done well, the advertiser-facing message compounds trust the way the auction’s “good ads win” message does: we penalize clickbait and protect the environment because it keeps the audience worth reaching — and that protects the value of your spend, too. Northwind, the recurring commerce advertiser, should prefer a platform that enforces quality, because a clean feed is what keeps the users it wants to reach from tuning out.
Same-Lever Scorecard
The same dial — how aggressively the platform demotes/penalizes low-quality and integrity-violating demand, and whether quality is an auction input or a diagnostic — across the majors. Figures dated and hedged inline.
| Platform | Quality/integrity mechanism | Quality as auction input? | Enforcement posture | Tell for the leader |
|---|---|---|---|---|
| Meta | Quality Ranking (above/avg/below); Account Quality 0–100; Andromeda reads creative quality | Yes — Ad Quality term in Total Value; below-tier pays higher eCPM | Shifting to proactive, pre-serve multimodal AI classifiers (2026) | Penalty is priced into the auction — the cleanest revenue-experience alignment |
| Professional-context policy + verified graph; smaller integrity surface | Relevance-weighted | Conservative; protects a scarce high-trust pool | ~$8.2B FY25 ad rev (est.) — trust dividend as premium price, low enforcement load | |
| TikTok | Engagement/watch-through quality; policy enforcement on a fast-moving content surface | High implicit weight | Heavy automation; large young-user safety + brand-suitability exposure | Integrity load scales with virality — the binding constraint as automation rises |
| Google / YouTube | Ads Safety pipeline; Quality Score (a diagnostic); Ad Rank quality term (live) | Split — live quality in Ad Rank, 1–10 Quality Score is diagnostic only | Industrial scale: 8.3B ads removed, 24.9M accounts suspended, 99%+ pre-serve (2025 report) | Integrity as a manufacturing line; measure by left-catch rate, not verdicts |
| Amazon | Relevance on first-party purchase data; retail policy + counterfeit/safety enforcement | Weighted toward purchase propensity | Closed-loop; quality tied to genuine purchase signal | Owned purchase data makes the quality estimate unusually honest |
| X (wildcard) | Loosened moderation; environment-level integrity | Posture-level, not parameter-level | The cautionary case — under-enforcement | ~$4.5B (2022) → ~$2.5B (2024) ad rev (est.); anchor advertisers to near-zero — the divergence run to its end |
Decision or Diagnostic?
Sort the chapter’s metrics by who owns them. The leader sets the integrity policy; the IC tunes the knobs that implement it.
| Decision (board / leader owns) | Diagnostic (IC / launch-review owns) |
|---|---|
| Enforcement aggressiveness — the steepness of the quality penalty curve and where it lands on the revenue-experience frontier | Quality Ranking (above/avg/below) — a single ad’s relative score; an account-team signal |
| Integrity revenue trade rate — how much bookable revenue you’ll knowingly decline to protect the environment | Quality Score (1–10) — Google’s in-UI diagnostic; not a direct auction input |
| Org separation of scorekeeper and spender — who owns and audits the enforcement dial | Pre-serve interception / left-catch rate — operational pipeline metric the integrity team optimizes |
| Brand-safety / environment posture — the standing you’ll hold even when it costs demand | Per-account negative-feedback rate, hide/report counts — component signals feeding the quality term |
The leader’s call. The trade-off you own is the enforcement aggressiveness of the quality and integrity system: how much of this quarter’s bookable revenue you knowingly decline by demoting clickbait, low-quality, and brand-unsafe demand, in order to protect the engagement and advertiser trust that produce next year’s revenue. The trap is the asymmetry — under-enforcement books a clean revenue win this quarter while the experience and trust costs arrive later and unattributed, so the dial drifts loose unless someone whose incentives span both lines holds it. Meta resolves this by pricing quality into the auction (below-average ads pay higher eCPM to win) and reporting DAP beside ARPP so the board sees engagement and extraction together; Google resolves the scale version by running integrity as a manufacturing line that intercepts 99%+ of violations pre-serve and is measured by how early it catches harm, not by suspension counts. X is the proof of the alternative: let the environment degrade and revenue does not erode gracefully — it falls from ~$4.5B to ~$2.5B (ad revenue, 2022→2024, est.) and anchor advertisers go to near-zero, and no auction tuning rebuilds it. Four quarters out: set the penalty curve too light and you book good near-term numbers, then watch session quality soften, brand budgets quietly migrate to cleaner inventory, and your regulatory exposure rise; set it sensibly and you trade a measurable point or two of near-term revenue for a feed that keeps producing impressions and an advertiser base that trusts the environment it is buying. Set the dial like an underwriter pricing a risk you will still be carrying next year — not like a sales rep clearing this quarter’s inventory.
Key terms
| Term | One-line definition |
|---|---|
| Quality Ranking | Meta’s relative ad-quality score (above/average/below versus competing ads), built from negative feedback, low-quality engagement, and clickbait signals. |
| Account Quality score | An account-level health signal (Meta exposes 0–100) that gates future ad approvals when it falls too low. |
| Penalty / demotion curve | The continuous function mapping an ad’s quality score to the extra eCPM cost it pays to win — the dial the leader sets. |
| Integrity-vs-revenue divergence | The structural tendency for the revenue-maximizing and experience-maximizing settings to pull apart toward more revenue and worse feed unless deliberately governed. |
| Pre-serve interception / left-catch | Catching policy-violating ads before they serve (Google: 99%+); the true measure of an integrity pipeline’s quality. |
| Quality Score (Google, 1–10) | An in-UI advertiser diagnostic (expected CTR, ad relevance, landing-page experience); informative but not a direct auction input. |
| Brand-safety / environment posture | The standing a platform holds on what content its ads will and won’t appear beside; the integrity surface that protects the advertiser, not just the user. |
| Scorekeeper / spender separation | Org-design principle that the function setting and auditing the enforcement dial must not report into the function carrying the revenue quota. |
Recap & what is next
- Ad quality and integrity are the user-value term made operational — a scoring system of demotions and penalties whose job is to keep revenue and experience from diverging; the leader owns the steepness of the penalty curve, not the individual verdicts.
- The system has two gates and a dial: a hard policy gate (block the prohibited) and a continuous quality dial (price the merely bad). Meta prices quality into the auction so below-average ads pay higher eCPM — the cleanest alignment of revenue and experience.
- Integrity at scale is a manufacturing line, not a courtroom: measure it by how far left it catches harm (Google’s 99%+ pre-serve interception), not by suspension counts, which are a lagging by-product.
- The divergence is an incentives problem before it is a modeling problem — separate the scorekeeper from the spender, report a long-horizon engagement metric (DAP) beside the revenue metric (ARPP), and make the penalty curve a named, defended decision.
- X is the cautionary tale run to its end: let the environment degrade and revenue falls off a cliff (~$4.5B → ~$2.5B ad rev, 2022→2024, est.; anchor advertisers to near-zero) that no auction tuning rebuilds. LinkedIn is the counterweight — protect the environment and be the premium.
- Sort the metrics ruthlessly: enforcement aggressiveness, integrity trade rate, org separation, brand-safety posture are yours; Quality Ranking, Quality Score, interception rate, negative-feedback counts belong to the launch desk.
Maya has now set the engine’s policy (ch4), funded its prediction quality (ch5), tuned its yield (ch6), and constrained it with integrity (this chapter). The core engine is built and governed. Chapter 8 — How Much Control Do You Take Away? — The Automation Frontier opens Part III by handing the whole machine to the advertiser as an automated black box: how far to abstract targeting, bidding, creative, and placement into Advantage+/Performance Max/Smart+, what guardrails to keep, and how to manage the loss-of-control backlash when the manual levers disappear — including the quality and integrity guardrails this chapter just defined, now running inside a system the advertiser can no longer see into.